S&P500 Trading Update 27/4/26
S&P500 Trading Update 27/4/26
***QUOTING ES1! FOR CASH US500 EQUIVALENT LEVELS, SUBTRACT POINT DIFFERENCE***
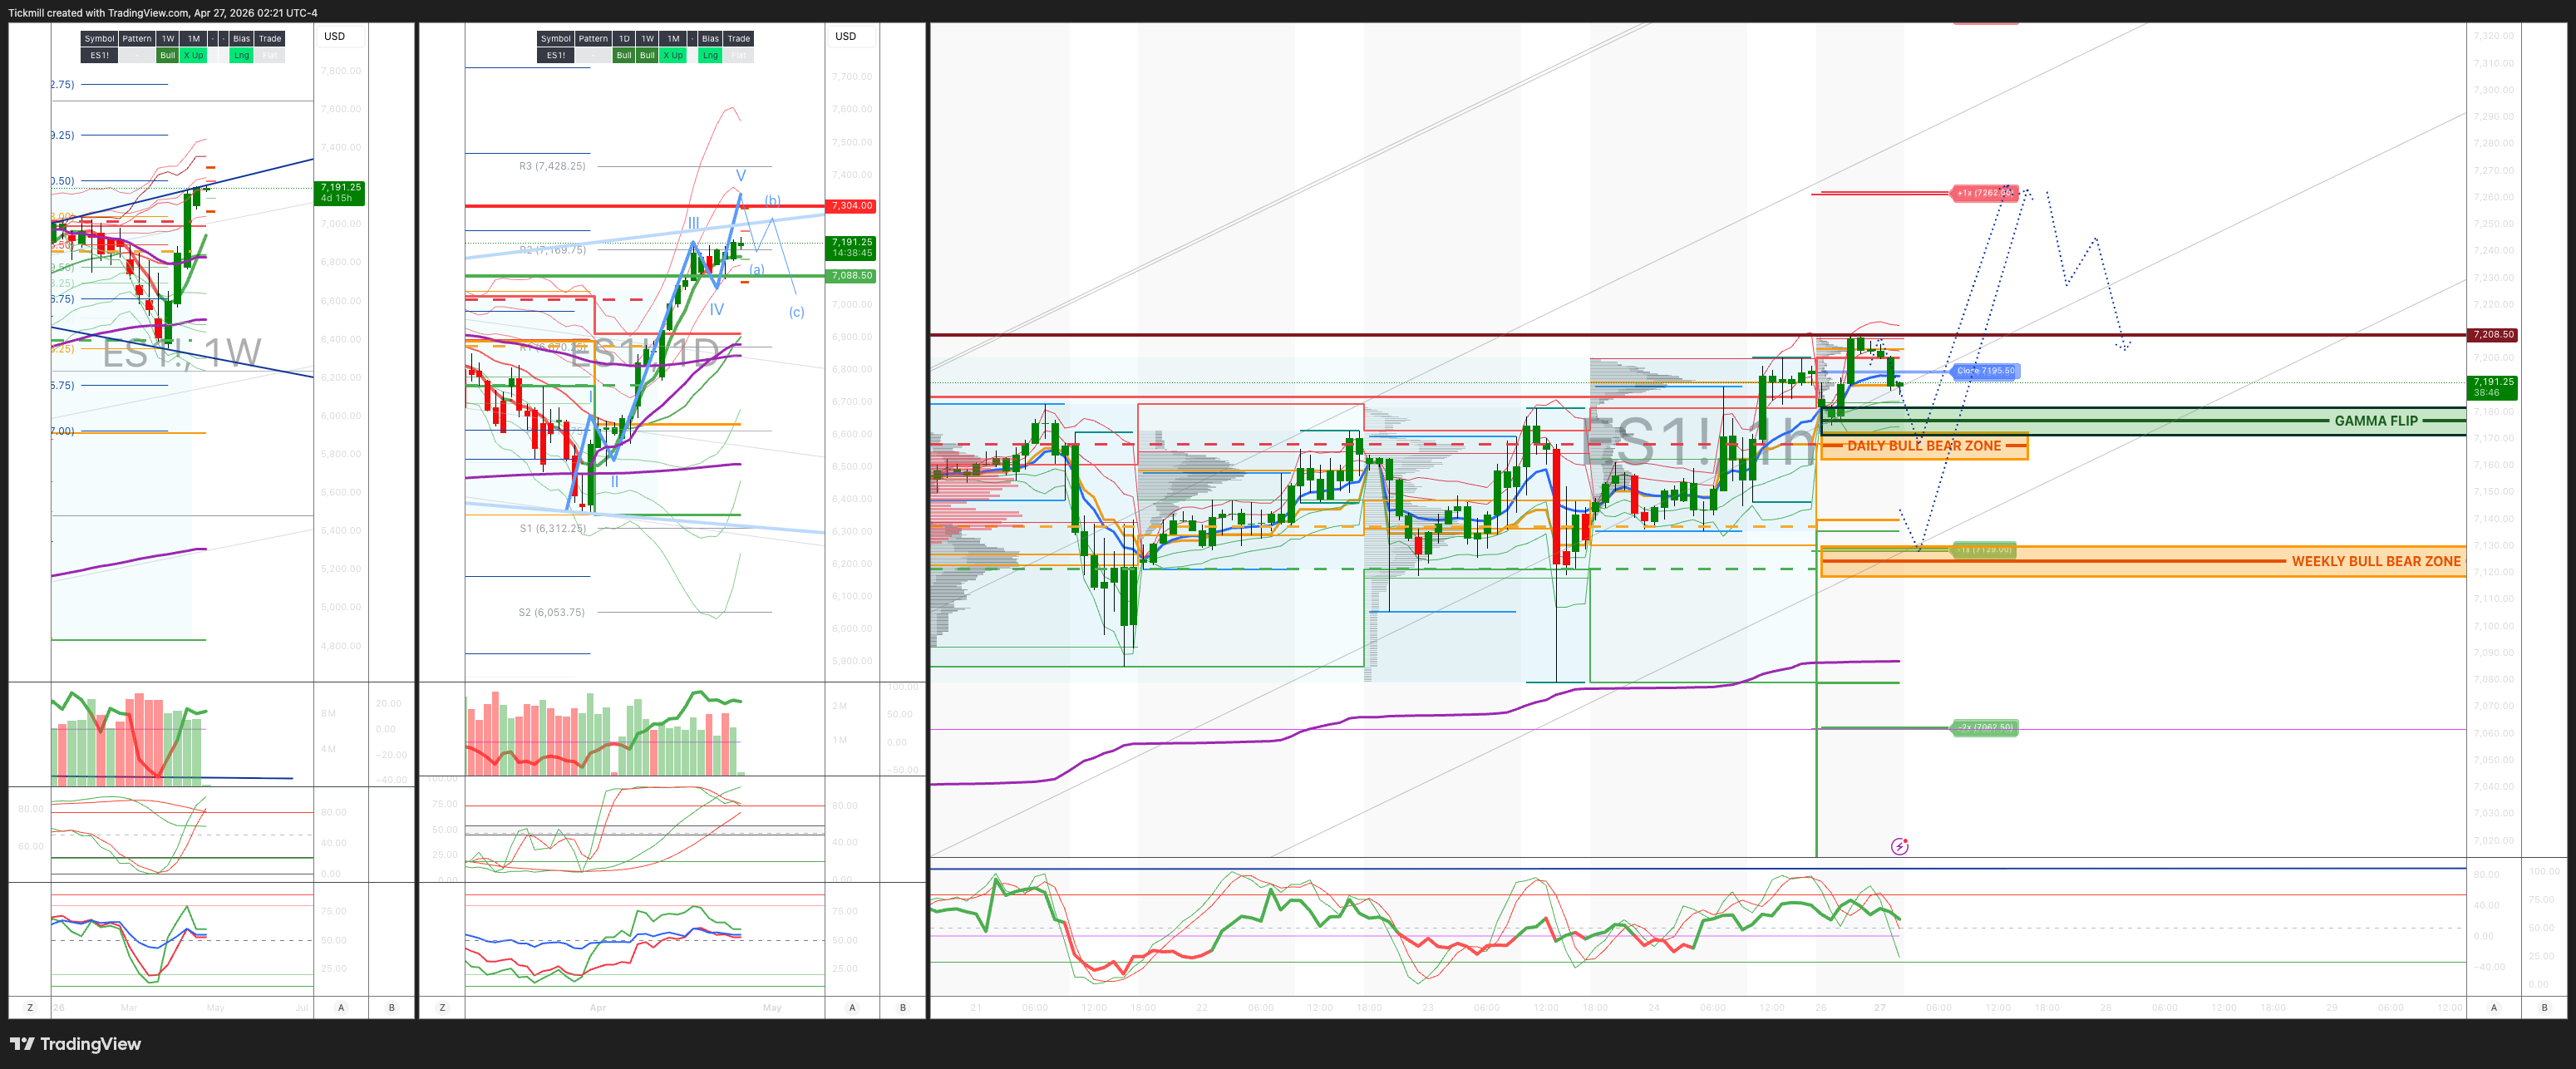
WEEKLY BULL BEAR ZONE 7130/20
WEEKLY RANGE RES 7304 SUP 7087
May OPEX Straddle: 225pt range implies a OPEX to OPEX range of [6900, 7350]
June QOPEX Straddle is 546.4pt giving us a range of [5960,7052]
JHEQX Q2 Collar 6189/6290 - 6865/6955
DEC2025 OPEX to DEC2026 OPEX is 945 points giving us a range of [5889,7779]
SPX PUT/CALL RATIO 1.06 (The numbers reflect options traded during the current session. A put-call ratio below 0.7 is generally considered bullish, and a put-call ratio above 1.0 is generally considered bearish)
DAILY VWAP BULLISH 7145
WEEKLY VWAP BULLISH 6819
MONTHLY VWAP BULLISH 6815
DAILY STRUCTURE – OTFH - 7145
WEEKLY STRUCTURE – OTFH - 7079
MONTHLY STRUCTURE - BALANCE
Balance: This refers to a market condition where prices move within a defined range, reflecting uncertainty as participants await further market-generated information. Our approach to balance includes favouring fade trades at the range extremes (highs/lows) while preparing for potential breakout scenarios if the balance shifts.
One-Time Framing Higher (OTFH): This represents a market trend where each successive bar forms a higher low, signalling a strong and consistent upward movement.
One-Time Framing Down (OTFD): This describes a market trend where each successive bar forms a lower high, indicating a pronounced and steady downward movement.
DAILY BULL BEAR ZONE 7170/60
GAMMA FLIP 7177
DELTA FLIP 6861
DAILY RANGE RES 7261 SUP 7128
2 SIGMA RES 7327 SUP 7061
VIX BULL BEAR ZONE 19.5
TRADES & TARGETS
LONG ON REJECT/RECLAIM OF DAILY BULL BEAR ZONE TARGET DAILY RANGE RES
LONG ON REJECT/RECLAIM OF WEEKLY BULL BEAR ZONE TARGET DAILY BULL BEAR ZONE> RTH CLOSE >DAILY RANGE RES
***ADDITIONAL SETUPS & TARGETS HIGHLIGHTED ON THE CHARTS***
(I FADE TESTS OF 2 SIGMA LEVELS ESPECIALLY INTO THE FINAL HOUR OF THE NY CASH SESSION AS 90% OF THE TIME WHEN TESTED THE MARKET WILL CLOSE ABOVE OR BELOW THESE LEVELS)
GOLDMAN SACHS TRADING DESK VIEW - ‘COLOUR ON THE WEEK’
Weekly Futures Desk: Index Holding Up, But Under the Surface Risk Is Being Cut
S&P finished roughly flat while NDX gained ~2%, but the headline index resilience hides a more defensive positioning backdrop. The market is still willing to look through unresolved US/Iran negotiation risk, but that lack of clarity kept broader risk appetite capped. The main support remained pockets of tech re-risking, especially AI / semis, while hedge fund activity was more balanced and increasingly tied to earnings outcomes.
The most important flow point: Prime shows the largest notional de-grossing in US equities in seven months, led by risk unwinds in single stocks. That is a meaningful change from the prior phase, where the rally was being driven by macro short-covering, CTA demand, and forced re-risking. This week looked more like selective buying in winners and active risk reduction elsewhere.
Prime / positioning read
US L/S exposures moved lower across the board:
Gross leverage: down 4.6 pts to 208.4%
now 3rd percentile one-year
Net leverage: down 1.8 pts to 51.7%
now 34th percentile one-year
Fundamental L/S ratio: down 0.7% to 1.660
still 65th percentile one-year
This is not a euphoric positioning backdrop. If anything, it says funds are taking down gross after the vertical move, but not abandoning the market. Net is lower, gross is much lower, and single-stock risk is being cut. That makes the tape more dependent on mega-cap earnings and macro catalysts next week.
Key themes:
international revisions may move lower near term due to Middle East uncertainty
bulls are looking through that toward a stronger 2027+ international ramp
NAM-exposed names are benefiting from potential pricing tailwinds
Futures desk setup for next week
What matters most
Mega-cap tech earnings
This is the main event.
The index is dependent on Mag7 / AI validation.
US/Iran headlines
Weekend negotiation headlines can reset the open.
Oil remains the cross-asset tell.
Central banks
FOMC, ECB, BOE, BOJ all in play.
Rates volatility can feed directly into equity duration / tech.
GDP and ISM
Growth data matters more now that the index is at highs.
Strong growth with sticky inflation would be less helpful than clean disinflationary growth.
Positioning
De-grossing means less crowded risk, but also less broad support.
If mega-cap tech misses, there is less cushion underneath.
Desk bias
Bias remains constructive, but more fragile.
The index is holding because leadership is working, earnings are beating, and AI remains the dominant capital allocation theme. But under the surface, the Prime data says managers are cutting gross aggressively, broad sector flows are negative, and the market is increasingly dependent on a narrow set of winners.
That does not mean bearish. It means the tape has shifted from:
broad squeeze / forced chase to:earnings-led leadership test
Disclaimer: The material provided is for information purposes only and should not be considered as investment advice. The views, information, or opinions expressed in the text belong solely to the author, and not to the author’s employer, organization, committee or other group or individual or company.
Past performance is not indicative of future results.
High Risk Warning: CFDs are complex instruments and come with a high risk of losing money rapidly due to leverage. 69% and 73% of retail investor accounts lose money when trading CFDs with Tickmill UK Ltd and Tickmill Europe Ltd respectively. You should consider whether you understand how CFDs work and whether you can afford to take the high risk of losing your money.
Futures and Options: Trading futures and options on margin carries a high degree of risk and may result in losses exceeding your initial investment. These products are not suitable for all investors. Ensure you fully understand the risks and take appropriate care to manage your risk.
Patrick has been involved in the financial markets for well over a decade as a self-educated professional trader and money manager. Flitting between the roles of market commentator, analyst and mentor, Patrick has improved the technical skills and psychological stance of literally hundreds of traders – coaching them to become savvy market operators!