Institutional Insights: Goldman Sachs 'Earnings Test Versus Positioning'

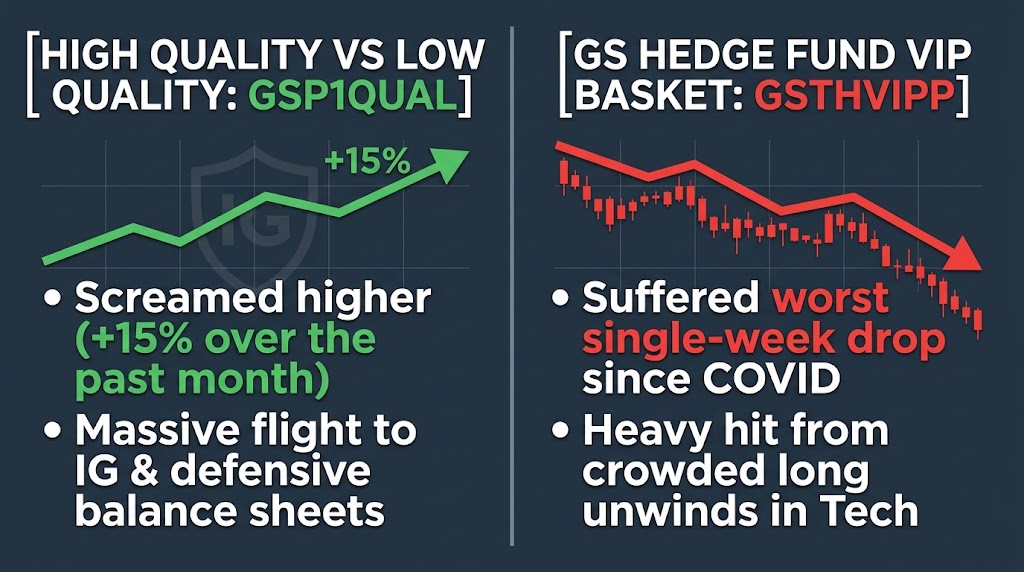
WEEKLY MACRO & POSITIONING BRIEFING: MONDAY MORNING "GREEN DOT" SETUP
Desk Analysis: Global Banking & Markets FICC & Equities
THE TAKE: EARNINGS TEST VS. EXTREME POSITIONING CAPITULATION
Following last week's historic technology liquidation—which drove US central Long/Short net exposure to its 0th percentile rank across 1-year, 2-year, and 5-year lookback horizons—global equity markets enter the core of Q3 earnings season with positioning thoroughly cleaned up. The technology sector experienced its largest single-week net selling in Goldman Sachs Prime dataset history, effectively erasing the YTD performance of the "AI Winners vs. AI At Risk" pair trade back to flat (0% YTD vs. +100% at June-end).
Despite credit spread widening in AI infrastructure debt (CCC spreads >1,000 bps) and headlines surrounding capital intensity, the fundamental setup features a powerful underlying broadening ("the revenge of everything else"). Last week, 350 S&P 500 constituents closed higher, and S&P 500 ex-AI outperformed the cap-weighted benchmark by +475 bps. With 58% of S&P 500 market capitalization reporting over the next two weeks (14% this week, 44% next week), the primary market catalyst shifts entirely to corporate earnings confirmation.
CROSS-ASSET POSITIONING & FACTOR EXTREMES
US Fundamental Long/Short Leverage:
Net Exposure: Dropped -3.2 points last week (largest 1-week decline since "Liberation Day") to sit at the 0th percentile across 1-year, 2-year, and 5-year timeframes.
Gross Exposure: Holds elevated at 213.9% (83rd percentile 3-year), confirming accounts have aggressively reduced directional length without shrinking gross portfolio scale.
Sector Flow Skews & One-Delta Activity:
Both Asset Managers and Hedge Funds were overlapping net sellers of TMT equities and Macro ETFs, applying concentrated selling pressure on mega-caps.
Financials attracted persistent long demand and short-covering interest into Q3 reporting.
Semiconductor Technical Oversold Signal:
Semiconductor equities dropped for 8 consecutive sessions into Friday's close—their longest losing streak since 2006—pushing relative RSI metrics to near-oversold territory for only the second time in 4 years.
Fixed Income CTA Buying Shift:
Following 7 consecutive sessions of gains in Treasury ETFs (
TLT), systematic trend-followers are modeled net short -$164M/bp DV01 globally. Baseline models project +$12M DV01 of systematic buying over 1 week and +$65M DV01 over 1 month as CTAs cover duration shorts.
DERIVATIVES & VOLATILITY DYNAMICS
Record S&P 500 Put Notional Volume: Friday's session registered the largest S&P 500 put option volume in market history, with over $3.3 trillion in gross notional trading hands.
GS Panic Index Spike: Surged from a 1-handle at the start of last week to 7.4 by Friday, marking one of the sharpest risk-premium injections on record.
VIX Term Structure Inversion: The front end of the VIX futures curve inverted into backwardation (Oct vs. Nov spread reaching -$1.29). Rapid normalization back into contango confirms that acute downside panic was quickly absorbed by systematic volatility supply.
Pre-Market Options Launch: Pre-market single-stock options trading officially commenced this morning across 29 designated tickers (7:30 AM – 9:25 AM ET session).
WEEK AHEAD EARNINGS & MACRO CATALYSTS
S&P 500 Earnings Waves: 14% of S&P 500 market cap reports this week, headlined by Meta Platforms (
META) on Wednesday as the first primary pressure test for megacap AI capex. 44% of index market cap reports the following week.Mutual Fund Tax Year-End: Final tax-loss harvesting waves from active mutual funds ($2.3T AUM ending fiscal year Oct 31) are completing, paving the way for November buyback liquidity (the 2nd largest buyback execution month of the year).
Disclaimer: The material provided is for information purposes only and should not be considered as investment advice. The views, information, or opinions expressed in the text belong solely to the author, and not to the author’s employer, organization, committee or other group or individual or company.
Past performance is not indicative of future results.
High Risk Warning: CFDs are complex instruments and come with a high risk of losing money rapidly due to leverage. 68% and 74% of retail investor accounts lose money when trading CFDs with Tickmill UK Ltd and Tickmill Europe Ltd respectively. You should consider whether you understand how CFDs work and whether you can afford to take the high risk of losing your money.
Futures and Options: Trading futures and options on margin carries a high degree of risk and may result in losses exceeding your initial investment. These products are not suitable for all investors. Ensure you fully understand the risks and take appropriate care to manage your risk.
Patrick has been involved in the financial markets for well over a decade as a self-educated professional trader and money manager. Flitting between the roles of market commentator, analyst and mentor, Patrick has improved the technical skills and psychological stance of literally hundreds of traders – coaching them to become savvy market operators!