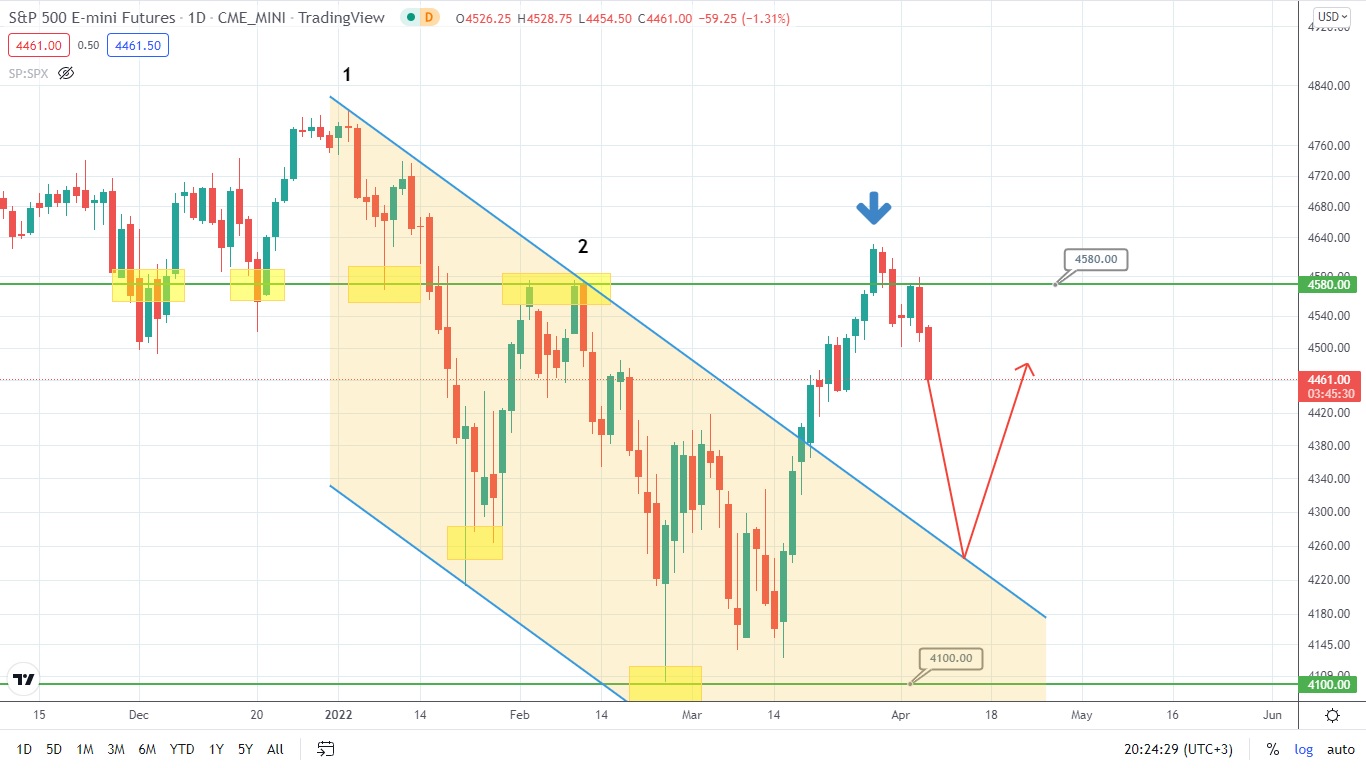
S&P500 Forecast: Potential Jump Ahead?
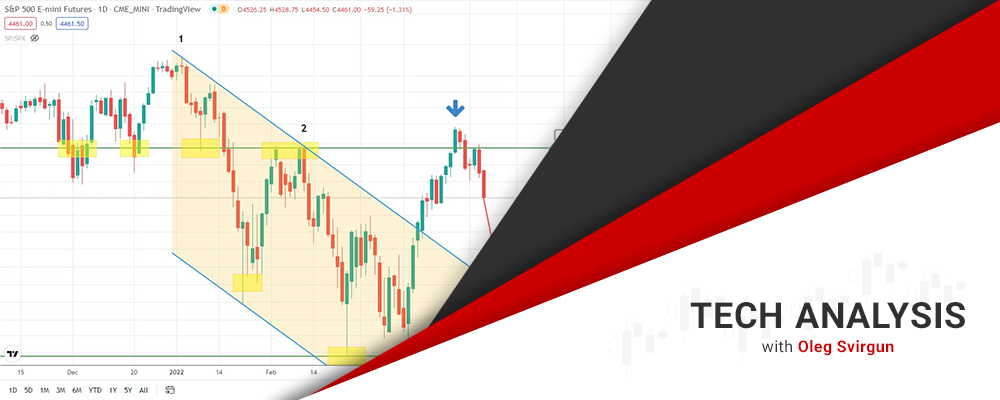
The US stock index S&P500 has pulled from the resistance at the level of 4580.00 and dropped. There is a broken downtrend on South. The downtrend might offer significant support to the asset’s price, advancing its reversal and jump. Hence, it is important to follow the candlestick formations around the broken downtrend.
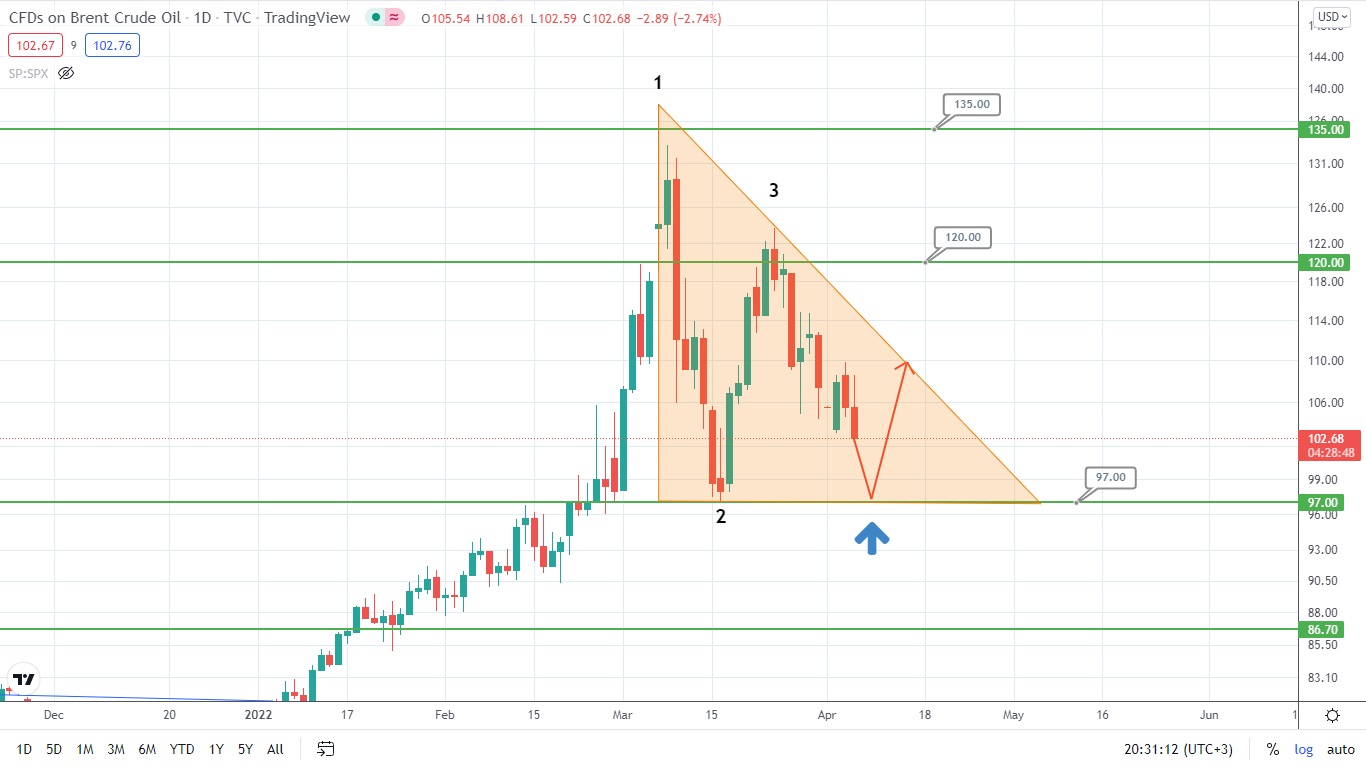
Brent oil is heading downwards, targeting the supporting level of 97.00. On the other side, a triangle is about to form soon. So, it is likely that oil might pull from the level of 97.00 and jump.
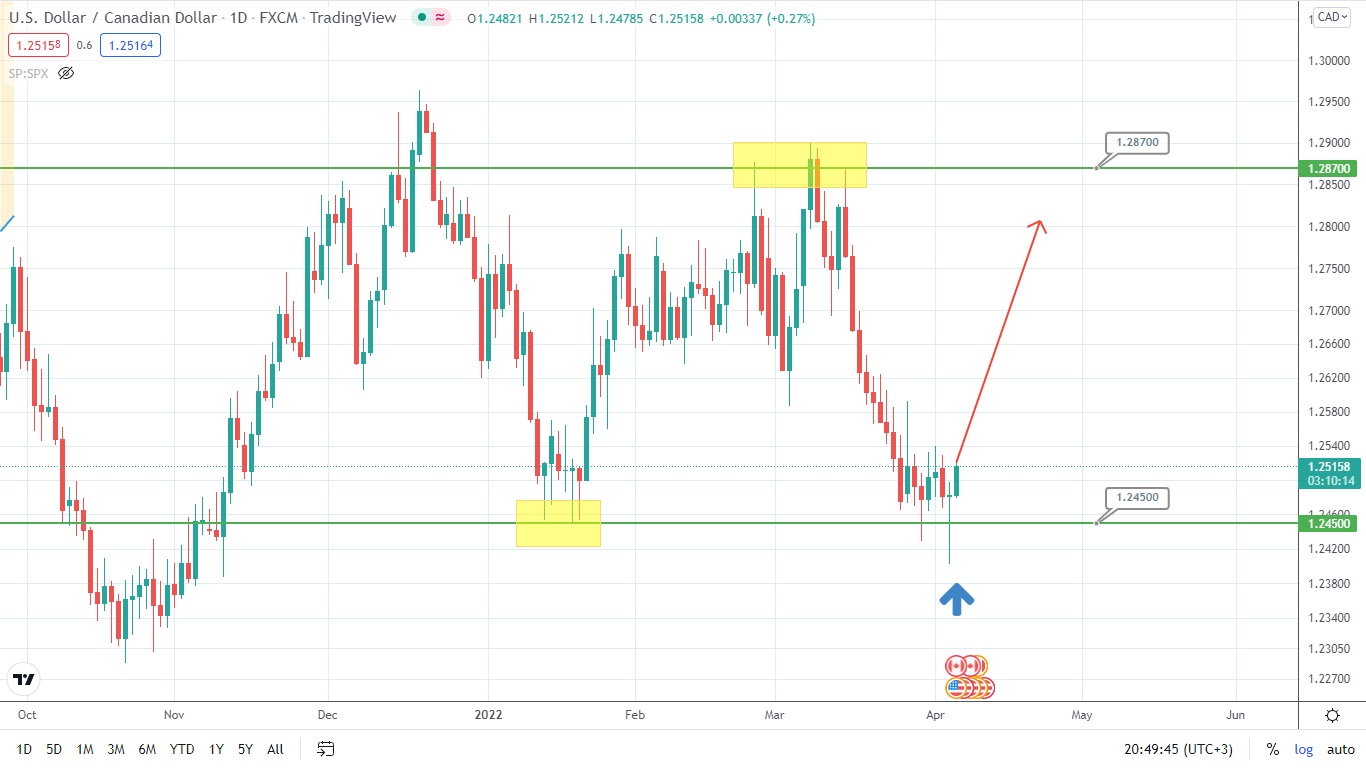
The USD/CAD pair has tested the supporting level of 1.2450 for the second time in a row, leaving a candle with a very long shadow behind. In principle, it is obvious that the lower boundary of the range did not break. Therefore, the asset’s price is likely to jump till the level of 1.2870.
Disclaimer: The material provided is for information purposes only and should not be considered as investment advice. The views, information, or opinions expressed in the text belong solely to the author, and not to the author’s employer, organization, committee or other group or individual or company.
Past performance is not indicative of future results.
High Risk Warning: CFDs are complex instruments and come with a high risk of losing money rapidly due to leverage. 69% and 73% of retail investor accounts lose money when trading CFDs with Tickmill UK Ltd and Tickmill Europe Ltd respectively. You should consider whether you understand how CFDs work and whether you can afford to take the high risk of losing your money.
Futures and Options: Trading futures and options on margin carries a high degree of risk and may result in losses exceeding your initial investment. These products are not suitable for all investors. Ensure you fully understand the risks and take appropriate care to manage your risk.