S&P500 Daily Action Areas & Price Targets 31/7/26

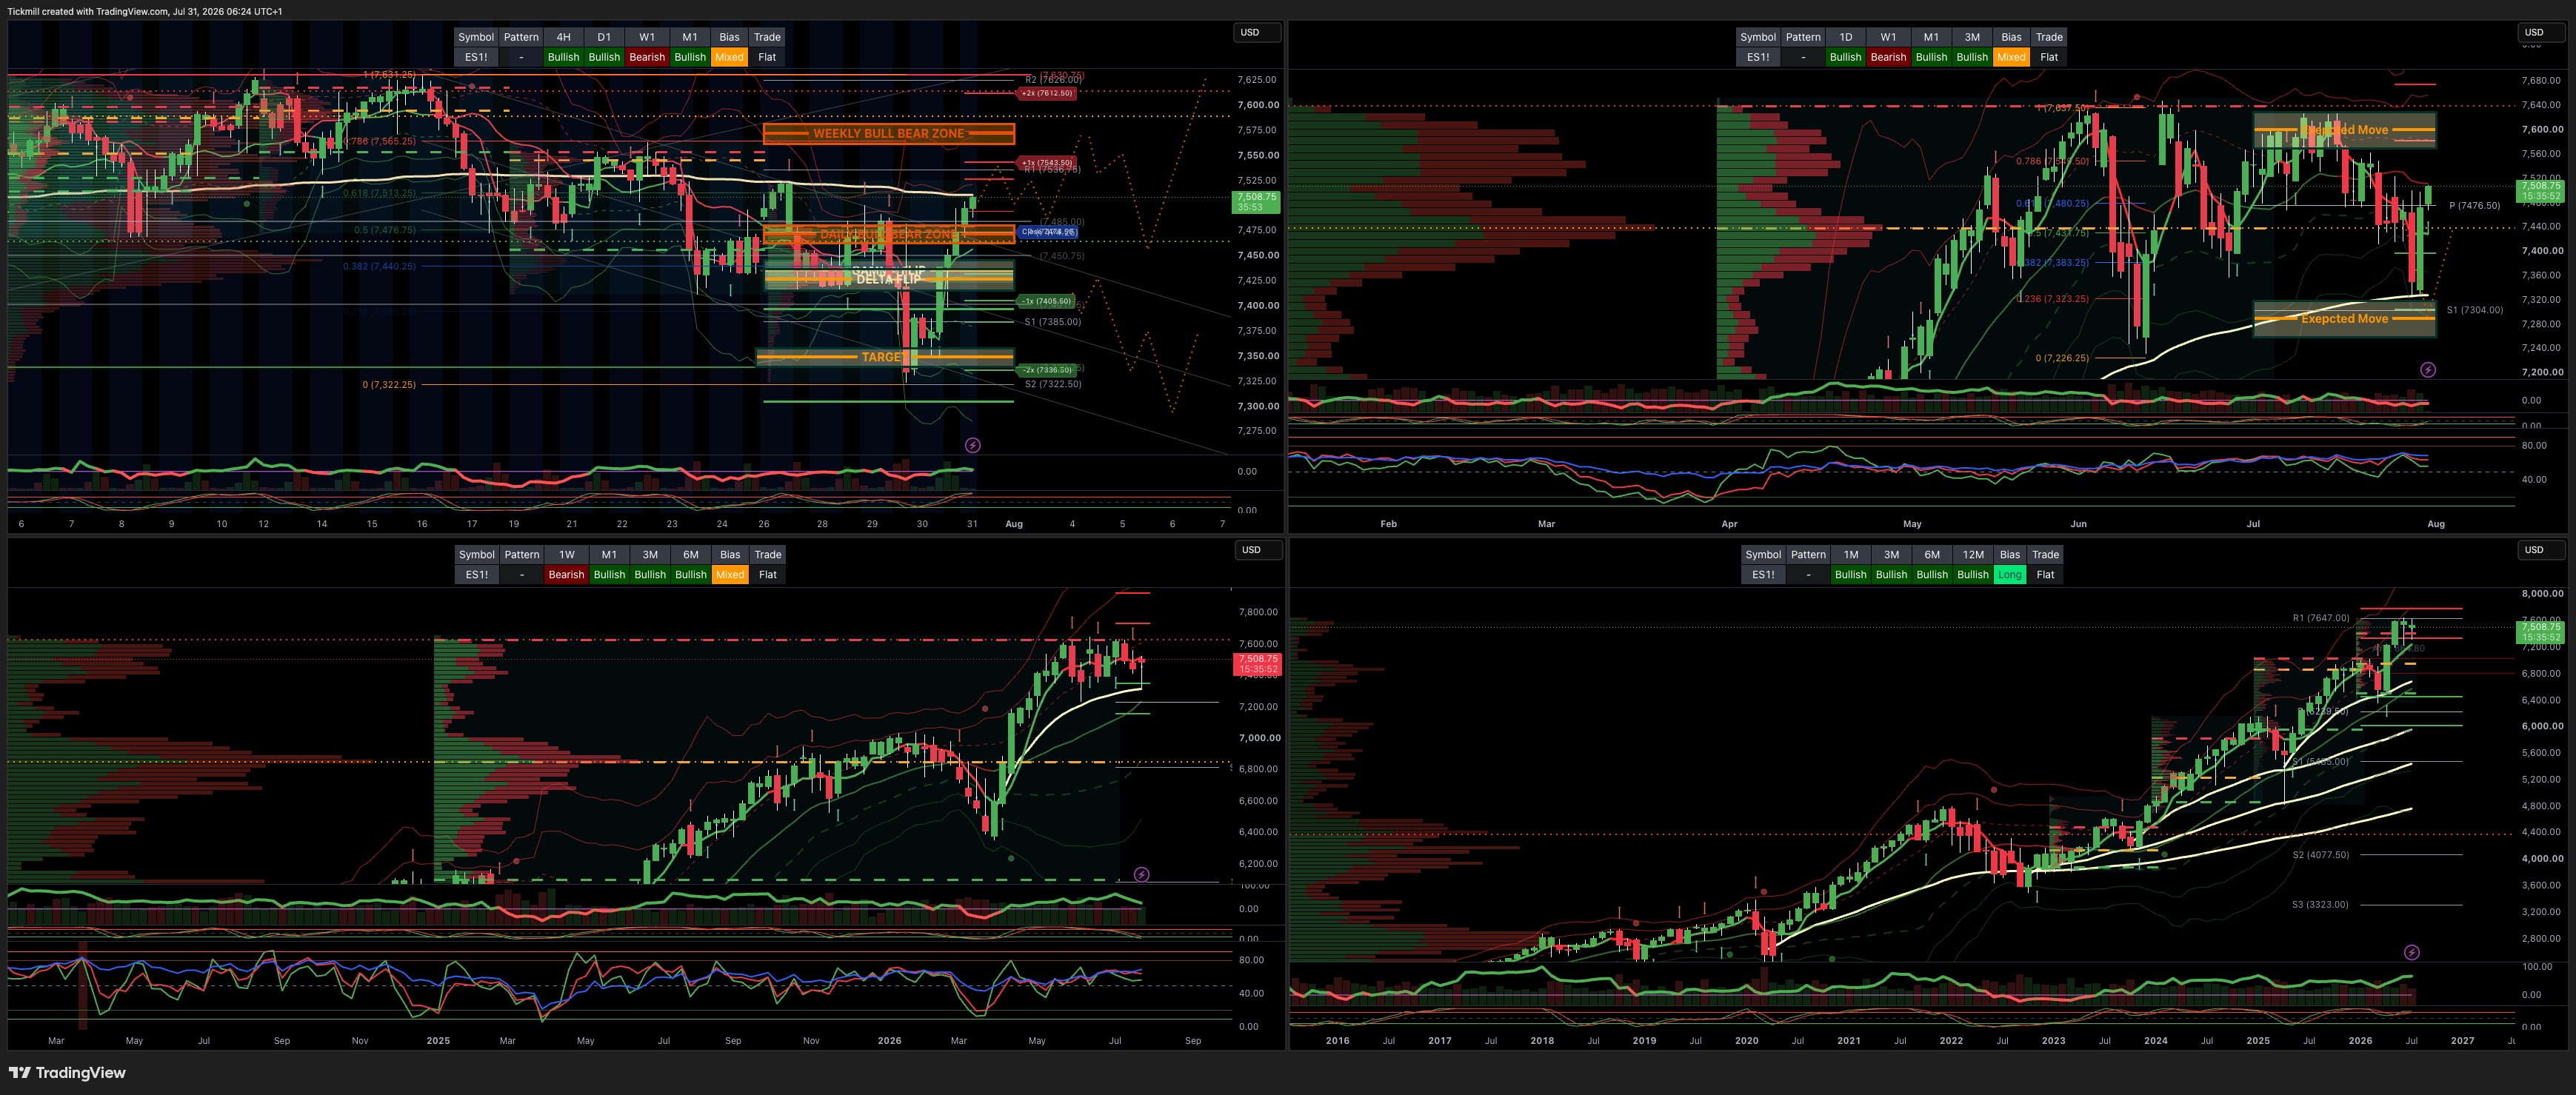
S&P500 Daily Action Areas & Price Targets 31/7/26
***QUOTING ES1! FOR CASH US500 EQUIVALENT LEVELS, SUBTRACT POINT DIFFERENCE***
WEEKLY BULL BEAR ZONE 7560/80
WEEKLY RANGE RES 7602 SUP 7301
MONTHLY RANGE RES 7838 SUP 7258
JHEQX Q3 Collar Short Call Cap: ~7,750 – 7,900 - Long Put Strike: ~7,050 – 7,100 (approx. 5% downside protection) Short Put Strike: ~5,950
DEC2025 OPEX to DEC2026 OPEX is 945 points giving us a range of [5889,7779]
SPX PUT/CALL RATIO 1.18 (The numbers reflect options traded during the current session.) A put-call ratio below 0.7 is generally considered bullish, and a put-call ratio above 1.0 is generally considered bearish.
GS Flow Desk: large S&P 31Aug 7000/7950 strangle in roughly $20mm vega / $115mm premium …My Read – classic “big convexity versus carry” trade: either someone paid a lot to own a wide August move, or someone got paid a lot to bet that the S&P stays comfortably inside the 7000–7950 corridor
DAILY VWAP BULLISH 7420
WEEKLY VWAP BEARISH 7522
MONTHLY VWAP BULLISH 7036
DAILY STRUCTURE - OTFL - 7478
WEEKLY STRUCTURE - BALANCE 7648/7247
MONTHLY STRUCTURE - OTFH - 7247
Balance: This refers to a market condition where prices move within a defined range, reflecting uncertainty as participants await further market-generated information. Our approach to balance includes favouring fade trades at the range extremes (highs/lows) while preparing for potential breakout scenarios if the balance shifts.
One-Time Framing Higher (OTFH): This represents a market trend where each successive bar forms a higher low, signalling a strong and consistent upward movement.
One-Time Framing Lower (OTFL): This describes a market trend where each successive bar forms a lower high, indicating a pronounced and steady downward movement.
DAILY BULL BEAR ZONE 7480/70
GAMMA FLIP 7436
DELTA FLIP 7426
DAILY RANGE RES 7543 SUP 7405
2 SIGMA RES 7612 SUP 7339
VIX BULL BEAR ZONE 17.9 (VVIX / VIX) 5.54
TRADES & TARGETS
LONG ON REJECT/RECLAIM DAILY BEAR ZONE TARGET DAILY RANGE RES>WEEKLY BULL BEAR ZONE
***ADDITIONAL SETUPS & TARGETS HIGHLIGHTED ON THE CHARTS***
(I FADE TESTS OF 2 SIGMA LEVELS ESPECIALLY INTO THE FINAL HOUR OF THE NY CASH SESSION AS 90% OF THE TIME WHEN TESTED THE MARKET WILL CLOSE ABOVE OR BELOW THESE LEVELS)
GOLDMAN SACHS FICC & EQUITY TRADING DESK VIEWS
Flow Setup Into August — Cleaner Positioning, but Limited Rally Fuel
The flow message is more nuanced now. The latest de-grossing has removed a major positioning headwind, but it has not automatically created a major upside catalyst. The market may be past the worst of forced momentum / tech liquidation, but the immediate sources of rally “juice” are limited.
The framework is:
Positioning is cleaner
Long-only / retail demand is fading
Buybacks are returning
Dealers cap upside locally
Systematic flows are asymmetrically downside-skewed
August seasonality is poor
Corr1 / macro-event risk is rising
So the tape can stabilize and trade more cleanly on fundamentals, but meaningful re-risking likely requires getting through the rubble of the past few weeks first.
1. Passive Inflows Have Been Enormous — But May Now Taper
Equity ETF and mutual funds have seen the largest YTD inflows on record, totaling US$659bn.
The passive / active split is striking:
Fund Type | YTD Flows |
|---|---|
Passive equity funds | +US$742bn |
Active equity funds | -US$83bn |
Total equity ETF + mutual fund flows | +US$659bn |
This highlights the massive appetite for momentum, leverage, and index beta, especially from retail. The nominal dollar figures are partly inflated by the growth in fund AUM, so they are less dramatic in percentage terms, but the flow impulse has still been very powerful.
July alone saw US$34bn of US equity fund inflows, the third-largest July in more than 20 years.
The issue is that this flow impulse is likely to taper in August. Signs of slowdown are already emerging.
2. August Fund-Flow Seasonality Is Bad
August is tied with May as the worst month for equity outflows from mutual funds and ETFs. This matters because the market is entering August with several reasons for buyers to step back:
Rising geopolitical risk
Higher energy prices
Monetary policy uncertainty
AI / momentum volatility
Poor tech earnings reactions
Weak liquidity
Elevated realized vol
The note frames this as a potential buyer’s strike in August and a seller’s battlefield. That does not necessarily mean equities must collapse, but it does mean dip-buying demand may be less reliable.
The most important implication: the market cannot count on the same passive / retail flow tailwind that supported the year-to-date rally.
3. Retail Activity Is Already Slowing
Retail activity is tracking below the past five-year average. The latest reading shows average daily retail notional traded as a percentage of present market cap is more than 3% below the average from 2021–2025.
That is a clear warning given how important retail has been to this year’s momentum / leverage appetite. If retail participation fades further into August, the market loses one of its more consistent short-term demand sources.
The suggested trade is:
GSXURFAV short-dated optionality
GSXURFAV = Goldman’s retail favorites basket
The logic is that if retail favorites are vulnerable to reduced retail activity, poor August flows, and macro uncertainty, short-dated optionality on that basket can monetize a volatility / downside event.
4. Buybacks Are the Main Supportive Flow
The best supportive flow into August is corporate buybacks.
Current and projected open-window estimates:
Timing | S&P 500 Companies in Open Window |
|---|---|
Now | 31% |
By end of next week | 53% |
By mid-August | Over 90% |
This is important because buybacks are one of the largest and most reliable sources of equity demand. As companies exit earnings blackout windows, discretionary buyback activity should step up meaningfully.
That can provide a persistent bid and cushion the market after the recent de-grossing. In a market where retail and passive flows may slow, buybacks become the dominant stabilizer.
However, buybacks usually support dips more than they create explosive upside. They are a stabilizing force, not necessarily a momentum-chasing force.
5. Prime Book: Positioning Cleaner, but Gross Still High on Longer Lookback
The prime book shows the de-grossing was real. Global Info Tech saw the most selling pressure. Friday’s long selling in global Info Tech was:
The largest since September 2024
One of the largest in the past five years
A -3.6 z-score event
Yesterday, the global book was net sold, driven by heavy long selling outpacing short covering by 1.4 to 1. All regions saw de-grossing:
US: long selling
EM Asia: long selling
DM Asia: short covering
Europe: short covering
All 11 US sectors saw risk unwinds, led by Tech.
The key conclusion from the desk is that positioning is no longer a major headwind. That allows for healthier trading on fundamentals. But there is a caveat: while the recent unwind has cleaned up the near-term setup, overall book gross leverage remains high on a longer-term lookback.
Metric | Percentile |
|---|---|
Overall book gross leverage, 5-year lookback | 93rd percentile |
Overall book gross leverage, 1-year lookback | 65th percentile |
So positioning is cleaner relative to the recent extreme, but not outright low in a multi-year context.
6. Gamma: Upside Capped, Downside Exacerbated
Dealer gamma positioning is not especially friendly for a sharp upside rally.
Dealers are:
Long S&P gamma locally
Getting longer gamma to the topside
Shorter gamma on the downside
This matters because dealer hedging can suppress upside volatility when markets rally. If dealers are long gamma locally / above spot, they sell into strength and buy into weakness, dampening moves. But if the market sells off into zones where dealers are shorter gamma, hedging can exacerbate downside moves.
Practical implication:
Upside rallies may be muted / rangebound
Downside moves can accelerate if support breaks
This fits the broader theme: limited rally juice, but still meaningful downside convexity risk.
7. Seasonality: IWM / Russell Looks Vulnerable
The Russell / IWM has historically struggled in the first two weeks of August. The note expects that seasonal pattern to continue given:
Monetary policy uncertainty
Geopolitical risk
Russell’s YTD outperformance
Higher sensitivity to rates
Smaller-cap balance sheet / financing sensitivity
Downside protection still screens reasonably. The IWM 1-month 25-delta put is in the:
48th percentile on a 1-year lookback
46th percentile on a 5-year lookback
So it is not especially expensive despite the risk setup. It also functions as a rate-hike proxy hedge.
Preferred hedge:
IWM 3-month puts
Or shorter-dated IWM puts around Fed / macro events
8. Systematic Positioning: Below Trigger, Downside Flow Risk Is Asymmetric
The market is now below the short-term SPX trigger level of 7,453. Continued weakness can unlock systematic selling, particularly from CTAs.
Systematic positioning:
Metric | Estimate |
|---|---|
Systematics long US equities | US$196.33bn |
Systematic positioning percentile, 3Y | 48th percentile |
CTA positioning percentile, 3Y | 44th percentile |
This is moderate positioning, not extreme. But because liquidity weakens in August, the same notional flows can have a larger market impact.
The flow asymmetry is the problem.
1-Week Flow Estimates
Tape Scenario | Global Systematic Flow | US Flow |
|---|---|---|
Flat tape | Sell US$1.32bn | Sell US$5.21bn |
Up tape | Buy US$2.34bn | Sell US$1.94bn |
Down tape | Sell US$24.89bn | Sell US$15.73bn |
1-Month Flow Estimates
Tape Scenario | Global Systematic Flow | US Flow |
|---|---|---|
Flat tape | Buy US$16.59bn | Sell US$3.19bn |
Up tape | Buy US$37.25bn | Buy US$10.66bn |
Down tape | Sell US$172.27bn | Sell US$68.39bn |
This is the key risk: a down tape can trigger significantly larger selling than an up tape triggers buying. Over one month, the downside scenario implies US$172.27bn of systematic selling globally, including US$68.39bn out of US equities.
That skew keeps downside protection relevant even after the recent selloff.
9. Election-Year Seasonality: Sideways, Then Higher — But Vol Rises
Goldman’s Portfolio Strategy team notes that US equities in midterm election years typically trade sideways into the elections and then trend higher into year-end.
But the volatility pattern is important:
Realized volatility tends to pick up toward late summer.
Volatility tends to ramp more sharply in the month immediately before the election.
Sideways index performance can still involve large rotations and drawdowns underneath the surface.
This supports the idea that investors should not simply sell equities wholesale, but should own protection and structure trades for choppy / higher-correlation risk.
10. Reverse Dispersion and Corr1 Risk
The note’s preferred trades include reverse dispersion, which fits the rising risk of a Corr1 macro event.
Traditional dispersion is:
Long single-name volatility
Short index volatility
Reverse dispersion is effectively the opposite:
Long index volatility
Short single-name volatility
This becomes attractive when single-name vol is elevated and index vol is still relatively cheap versus the risk of correlations rising. If a macro shock hits — crude, rates, Fed credibility, geopolitical escalation — correlations can jump and index vol can reprice sharply higher.
That is the Corr1 event risk.
Why this matters now:
Single-stock volatility is already elevated.
Index volatility has lagged relative to factor volatility.
Dispersion trades remain crowded.
Dealer gamma can amplify downside.
Systematic selling is asymmetric.
August liquidity is poor.
Macro risk is rising.
So protective trades that monetize a move from stock-specific volatility to index-level correlation are attractive.
11. Favorite Trade Summary
Goldman flow desks’ preferred trades:
Trade | Rationale |
|---|---|
Reverse dispersion | Benefits if macro shock drives correlation higher and index vol catches up |
IWM 3-month puts | Hedge for rates / hike risk, August Russell weakness, small-cap vulnerability |
GSXURFAV optionality | Expresses fading retail activity and vulnerability in retail favorites |
These trades all share a common theme: they protect against the loss of retail / momentum support and a transition from idiosyncratic volatility to index-level volatility.
12. Tactical Market Framework
Bullish Supports
Positioning is cleaner after de-grossing.
Tech selling may be in later innings.
Buybacks are returning quickly.
Over 90% of S&P 500 open window by mid-August.
Fundamentals can matter more once positioning pressure fades.
Long-only interest in Tech / AI is rising.
Bearish / Capping Forces
Passive / retail inflows likely taper in August.
August is historically poor for equity fund flows.
Dealer gamma caps upside and worsens downside.
Systematic flow asymmetry is downside-skewed.
SPX is already below short-term trigger 7,453.
Macro risk remains elevated: crude, rates, Fed credibility, geopolitics.
Momentum / AI volatility is still extreme.
Actual long-only buying has not yet appeared in size.
Disclaimer: The material provided is for information purposes only and should not be considered as investment advice. The views, information, or opinions expressed in the text belong solely to the author, and not to the author’s employer, organization, committee or other group or individual or company.
Past performance is not indicative of future results.
High Risk Warning: CFDs are complex instruments and come with a high risk of losing money rapidly due to leverage. 68% and 74% of retail investor accounts lose money when trading CFDs with Tickmill UK Ltd and Tickmill Europe Ltd respectively. You should consider whether you understand how CFDs work and whether you can afford to take the high risk of losing your money.
Futures and Options: Trading futures and options on margin carries a high degree of risk and may result in losses exceeding your initial investment. These products are not suitable for all investors. Ensure you fully understand the risks and take appropriate care to manage your risk.
Patrick has been involved in the financial markets for well over a decade as a self-educated professional trader and money manager. Flitting between the roles of market commentator, analyst and mentor, Patrick has improved the technical skills and psychological stance of literally hundreds of traders – coaching them to become savvy market operators!