S&P500 Daily Action Areas & Price Targets 21/7/26

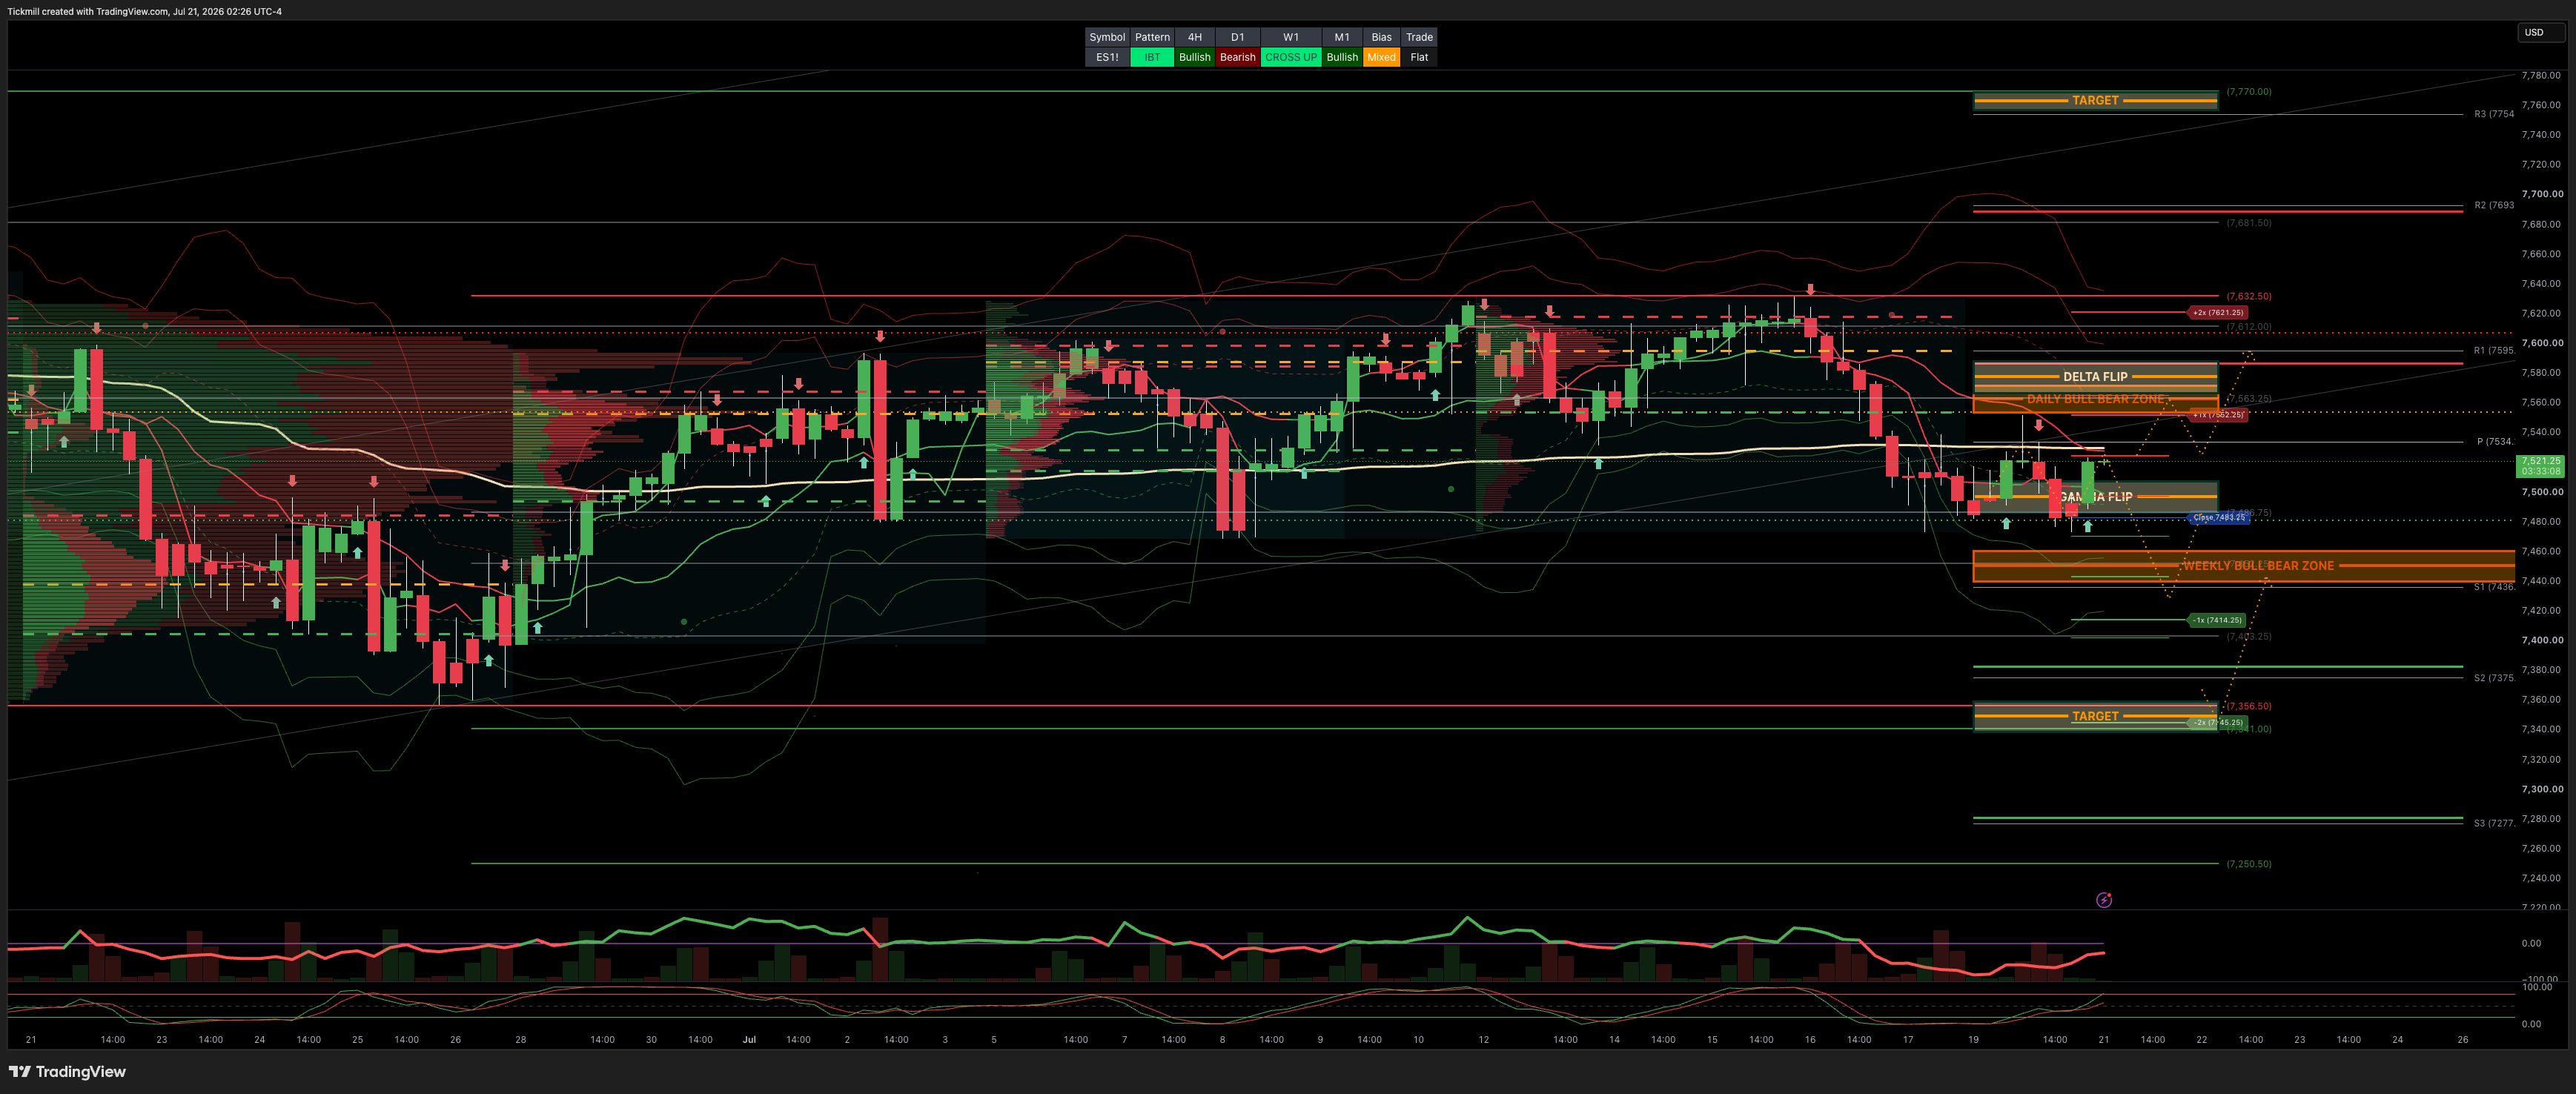
S&P500 Daily Action Areas & Price Targets 21/7/26
***QUOTING ES1! FOR CASH US500 EQUIVALENT LEVELS, SUBTRACT POINT DIFFERENCE***
WEEKLY BULL BEAR ZONE 7460/40
WEEKLY RANGE RES 7632 SUP 7358
MONTHLY RANGE RES 7838 SUP 7258
JHEQX Q3 Collar Short Call Cap: ~7,750 – 7,900 - Long Put Strike: ~7,050 – 7,100 (approx. 5% downside protection) Short Put Strike: ~5,950
DEC2025 OPEX to DEC2026 OPEX is 945 points giving us a range of [5889,7779]
SPX PUT/CALL RATIO 1.15 (The numbers reflect options traded during the current session.) A put-call ratio below 0.7 is generally considered bullish, and a put-call ratio above 1.0 is generally considered bearish.
GS Flow Desk: large S&P 31Aug 7000/7950 strangle in roughly $20mm vega / $115mm premium …My Read – classic “big convexity versus carry” trade: either someone paid a lot to own a wide August move, or someone got paid a lot to bet that the S&P stays comfortably inside the 7000–7950 corridor
DAILY VWAP BEARISH 7540
WEEKLY VWAP BEARISH 7563
MONTHLY VWAP BULLISH 7036
DAILY STRUCTURE - BALANCE 7627/7469
WEEKLY STRUCTURE - BALANCE 7648/7247
MONTHLY STRUCTURE - OTFH - 7247
Balance: This refers to a market condition where prices move within a defined range, reflecting uncertainty as participants await further market-generated information. Our approach to balance includes favouring fade trades at the range extremes (highs/lows) while preparing for potential breakout scenarios if the balance shifts.
One-Time Framing Higher (OTFH): This represents a market trend where each successive bar forms a higher low, signalling a strong and consistent upward movement.
One-Time Framing Lower (OTFL): This describes a market trend where each successive bar forms a lower high, indicating a pronounced and steady downward movement.
DAILY BULL BEAR ZONE 7555/65
GAMMA FLIP 7497
DELTA FLIP 7577
DAILY RANGE RES 7552 SUP 7414
2 SIGMA RES 7621 SUP 7334
VIX BULL BEAR ZONE 17.4
TRADES & TARGETS
SHORT ON REJECT/RECLAIM DAILY BULL/BEAR ZONE TARGET RTH CLOSE>WEEKLY BULL/BEAR ZONE
LONG ON REJECT/RECLAIM WEEKLY BULL/BEAR ZONE TARGET RTH CLOSE>DAILY BULL/BEAR ZONE
***ADDITIONAL SETUPS & TARGETS HIGHLIGHTED ON THE CHARTS***
(I FADE TESTS OF 2 SIGMA LEVELS ESPECIALLY INTO THE FINAL HOUR OF THE NY CASH SESSION AS 90% OF THE TIME WHEN TESTED THE MARKET WILL CLOSE ABOVE OR BELOW THESE LEVELS)
GOLDMAN SACHS FICC & EQUITIES TRADING DESK VIEWS
US Equities Color — Quiet Start, Heavy Micro Week, Semis Still Searching for Demand
US equities started the week quietly, with the market focused on whether semis can stabilize ahead of a major micro catalyst slate. The S&P 500 fell 19bps to 7,443, the NDX was essentially flat at +4bps to 28,604, the Russell 2000 declined 40bps to 2,950, and the Dow dropped 59bps to 51,841. The close saw a $4.7bn MOC to sell, and overall activity remained very muted, with 15.425bn shares traded across US equity exchanges versus a YTD daily average of 19.481bn.
Cross-asset price action was mixed but not especially supportive. VIX fell 128bps to 18.54, WTI rose another 59bps to $82.98, the US 10-year yield increased 4.2bps to 4.5897%, gold slipped 22bps to 4,008, DXY gained 18bps to 100.94, and Bitcoin rose 83bps to $65,029. The main macro issue remains the same: the market has received benign inflation data, but oil remains firm and yields are not providing a clean tailwind.
The most important index-level point is that the S&P closed at 7,443, only modestly above the key short-term CTA pivot at 7,427. That keeps the market very close to the first systematic-flow line in the sand. We are not yet below the pivot, but the cushion is now only about 16 points, or roughly 21bps. In a week where the implied move is much larger than that, this level matters.
This Week’s Setup — Heavy Micro, Light Macro
This is a heavy micro / light macro week. Roughly 18% of S&P 500 market cap reports, with the spotlight on:
GOOG/GOOGL and TSLA on Wednesday
Industrials / defense: LMT, RTX, HON, UNP on Thursday
AMD’s Advancing AI event
DHI tomorrow as the first major housing read
BX Thursday for Alts
Fed blackout ahead of the July 29 FOMC
With the Fed in blackout and US macro data light, the market’s direction should be determined primarily by earnings, guidance, and especially AI capex commentary. This is a critical setup because the AI/semi/momentum unwind has already produced meaningful de-risking and signs of capitulation. Now the market needs the earnings data to either validate the reset or deepen the drawdown.
Semis / AI — Stabilization Watch, but Demand Still Thin
The market was closely watching semis for signs of stabilization. SMH finished up small, but there was not much evidence of real demand yet. That is the key issue: after a violent unwind, price stabilization is helpful, but investors are still not stepping in with conviction.
GS Prime continues to highlight significant and ongoing length reduction in TMT. Info Tech was by far the most net-sold US sector last week, and the sector has now been sold in six of the past eight weeks. In cumulative percentage terms, the recent selling in Info Tech is the largest in the GS PB record, spanning more than 10 years.
That is a very important positioning signal. It supports the idea that the AI/momentum unwind is in the later innings, because a huge amount of length has already been removed. But it also highlights the scale of the damage: this is no longer just a mild “healthy pullback.” It has become a major TMT de-risking episode.
The next step is whether the earnings catalysts can stabilize the narrative. The market needs positive evidence from hyperscalers: cloud growth, margins, backlog, and 2027 capex intentions. Without that, semis may continue to struggle even with positioning much cleaner.
Hyperscaler Capex — 2027 Planning Is the Key Question
Hyperscaler capex remains the most important debate in the market. Consensus 2026 capex expectations jumped by more than $100bn after last quarter. GS analysts think 2026 budgets are largely set, which shifts the focus toward 2027 planning.
For GOOGL, the bar is nuanced. Even if the company simply reiterates current consensus capex estimates, that could represent a notable narrative shift because the market expects both the rate of capex increase and the capex-to-revenue ratio to slow.
Current Street modeling for GOOGL capex:
Year | Capex Estimate | Growth |
|---|---|---|
2026 | ~$186bn | +103% Y/Y |
2027 | ~$252bn | +35% Y/Y |
2028 | ~$270.3bn | +7% Y/Y |
The market will care less about whether 2026 is high — that is already known — and more about whether management commentary suggests another leg higher in 2027 or a moderation phase. The distinction matters enormously for semis, memory, semicap equipment, data-center equipment, datacenter REITs, power, and AI infrastructure broadly.
A constructive GOOGL print would ideally include:
Strong cloud revenue growth
Healthy margins despite AI investment
Large AI / cloud backlog
Capex commentary that does not imply a sharp spending slowdown
Evidence that AI demand is translating into monetizable enterprise use cases
If GOOG/GOOGL can deliver that, the setup for a relief rally in AI infrastructure improves materially given the extent of recent de-risking.
Consumer — Better Pockets
There were pockets of consumer outperformance. DPZ helped sentiment with better comp sales, while NOMD preliminary results were also better. That is notable because the consumer has been under scrutiny given higher energy prices, elevated rates, and concerns about elasticity.
The consumer read-through is still mixed, but today’s action suggests investors are willing to reward clean comp and topline delivery where expectations are manageable. This fits the broader earnings-season theme: the median stock has a lower bar than the index, and idiosyncratic beats can work even if AI remains volatile.
Housing — Weak on Rates, but Earnings Could Be Better Than Tape
Housing was weak as the US 10-year yield rose to 4.59%. That makes sense mechanically: higher yields pressure mortgage affordability and housing multiples.
However, feedback suggests results in the space this week could be okay, starting with DHI tomorrow. Housing remains a key area where the market will look for evidence that demand is resilient despite higher rates. Commentary on orders, incentives, affordability, gross margins, and cancellation rates will matter.
If DHI can deliver stable demand and reasonable margin commentary, it could help support the broader cyclical / broadening trade.
Alts — More Questions Than Answers
Alts were weak, with the initial move lower in HLNE and OWL spreading across the group. The reason for the move was not entirely clear, which makes it more notable. When a group sells off without a clean catalyst, it often reflects positioning, concern ahead of earnings, or sensitivity to rates / realizations.
BX reports Thursday, and expectations appear mixed. Investors expect strength in:
Fee-related performance revenue
Positive commentary on private equity
AI capex-related opportunities
Retail demand / fundraising state of the union
But there are concerns around:
Management fee trajectory
Realizations
Whether Street numbers embed too much optimism
BX will be an important read not only for Alts, but also for broader private markets sentiment, credit performance, retail flows, and AI infrastructure financing.
Flows — Quiet but Better to Buy
The floor was only a 3 out of 10 in terms of overall activity, underscoring the quiet summer tape. But the desk finished +743bps better to buy versus a 30-day average of -40bps, with single-stock activity muted and both asset managers and hedge funds finishing small net buyers, driven by tech.
That is a useful nuance. The tape was not strong, and the close had a large sell imbalance, but underlying high-touch flows were still better to buy, especially in tech. This may reflect early re-engagement after the large TMT de-risking, though demand remains tentative.
Also notable: SpaceX earnings date is officially on the tape, with 2Q results scheduled for August 4.
Derivatives — Vol Offered Despite a Late-Day Fade
It was a quiet day on the vol desk despite the market tumbling into the close. S&P and NDX vols were slightly offered across the surface, while NDX skew was bid further out on the curve. The interesting move was a parallel shift lower in the vol surface, with longer-dated vols offered more aggressively than expected.
Following last Friday’s expiry, dealer gamma positioning should be cleaner across the board. That may reduce some of the mechanical pressure from prior positioning, though it does not remove the catalyst risk from earnings.
The GS US Vol Panic Index has moved sharply higher over the past six sessions, rising from 1.3 to 6.75 out of 10. That is important. Even though spot vol was offered today, the broader panic/hedging backdrop has deteriorated significantly from the complacent levels seen earlier in July. The market is no longer as sleepy as it looked two weeks ago.
The desk likes end-of-week QQQ calls as an upside shot into the micro-heavy week. The rationale is compelling:
QQQ has averaged roughly ±1.6% daily moves over the last 30 sessions.
QQQ has out-realized its daily implied move by almost 1.4x over that period.
Gamma has not repriced as much as expected.
AI/TMT positioning is much cleaner.
A positive hyperscaler catalyst could generate a sharp relief rally.
This is a clean expression of the view that positioning is washed out enough for upside optionality to work if GOOG/GOOGL or AMD provide a positive catalyst.
Implied Range Projection
The S&P implied move for the rest of the week is 1.34%. With the S&P closing at 7,443, that implies a move of roughly:
Rest-of-week implied SPX range: 7,343 to 7,543.
This range is important because the downside bound is now meaningfully below the short-term CTA pivot at 7,427.
Key levels:
Level | Significance |
|---|---|
7,543 | Upper end of rest-of-week implied range |
7,443 | Current SPX close |
7,427 | Short-term CTA pivot |
7,343 | Lower end of rest-of-week implied range |
The market closed only 16 points above the CTA pivot, and the options market is pricing a normal weekly downside move that would take the index well below that level. A sustained break below 7,427 would increase the risk that the CTA flow profile deteriorates and could turn a micro-driven selloff into a more systematic-flow-driven move.
On the upside, 7,543 would effectively retrace back toward last week’s stabilization zone. A move through that level would likely require better AI capex commentary, semi stabilization, and continued benign rate action.
Disclaimer: The material provided is for information purposes only and should not be considered as investment advice. The views, information, or opinions expressed in the text belong solely to the author, and not to the author’s employer, organization, committee or other group or individual or company.
Past performance is not indicative of future results.
High Risk Warning: CFDs are complex instruments and come with a high risk of losing money rapidly due to leverage. 68% and 74% of retail investor accounts lose money when trading CFDs with Tickmill UK Ltd and Tickmill Europe Ltd respectively. You should consider whether you understand how CFDs work and whether you can afford to take the high risk of losing your money.
Futures and Options: Trading futures and options on margin carries a high degree of risk and may result in losses exceeding your initial investment. These products are not suitable for all investors. Ensure you fully understand the risks and take appropriate care to manage your risk.
Patrick has been involved in the financial markets for well over a decade as a self-educated professional trader and money manager. Flitting between the roles of market commentator, analyst and mentor, Patrick has improved the technical skills and psychological stance of literally hundreds of traders – coaching them to become savvy market operators!