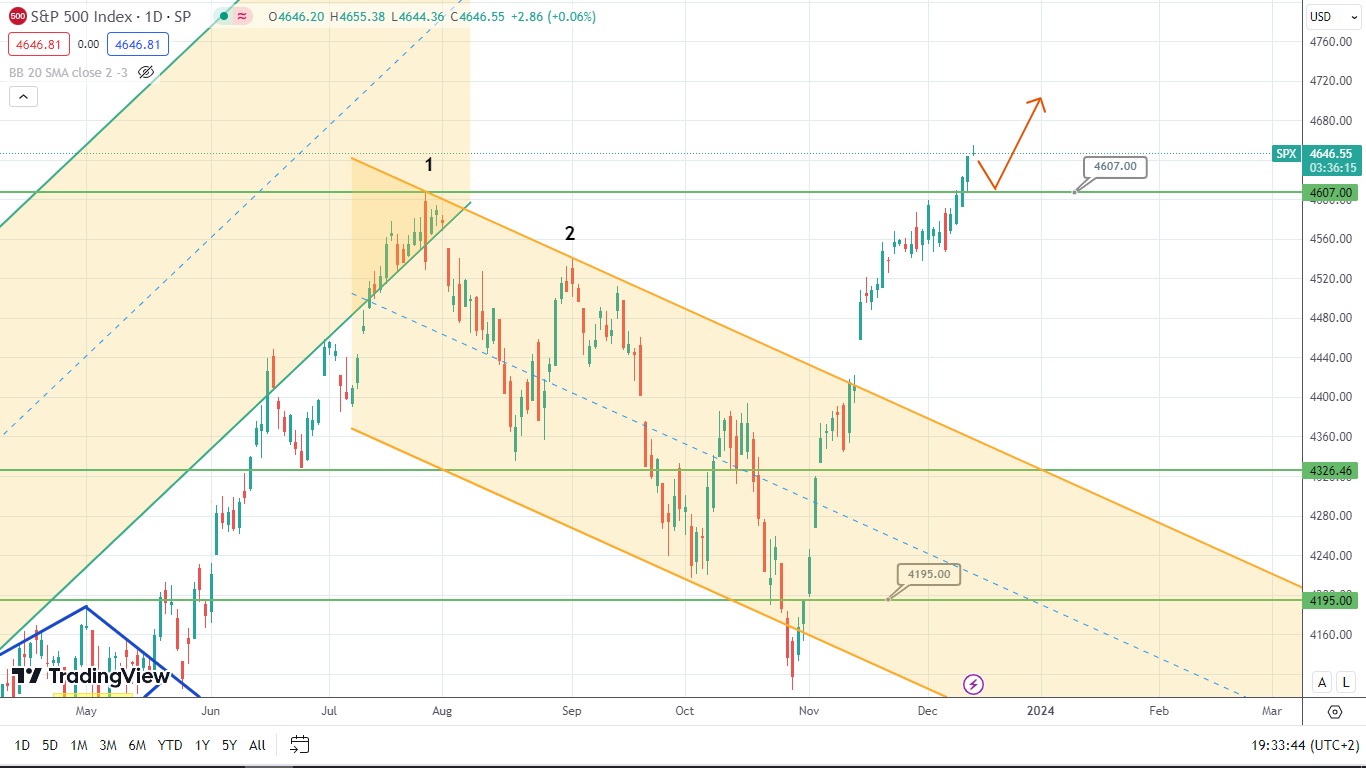
S&P 500 Analysis: Potential Price Rise Ahead?

The price of the American stock index S&P500 broke the resistance at the level of 4607. So, it might rebound and rise again soon. The formation of a bullish trap is also possible at this stage. Hence, it would be wise to follow the candlestick formations to forecast the next price move.
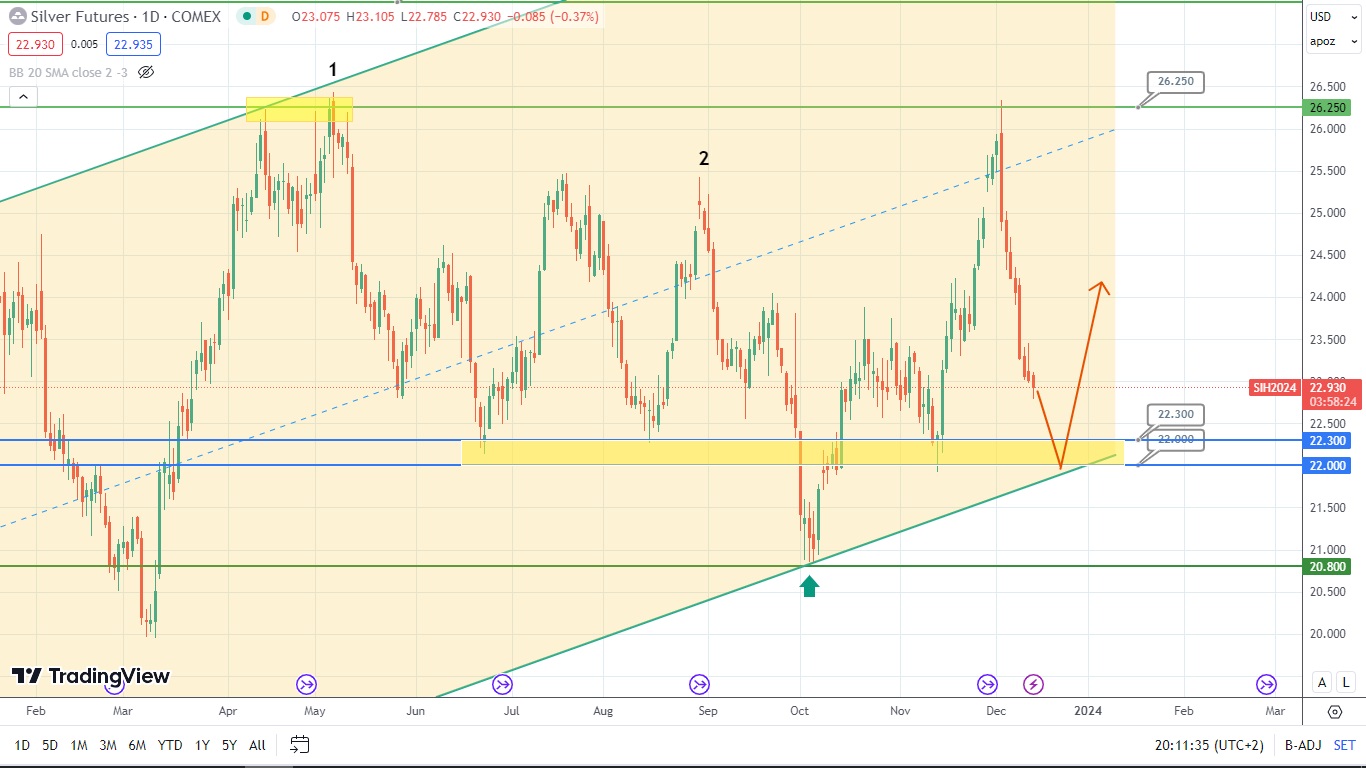
Silver is heading down and approaching the supporting zone formed between levels 22.00 and 22.30 and the uptrend. The price of silver is likely to rebound from this zone, uptrend, and jump. So, let’s observe if it will happen.
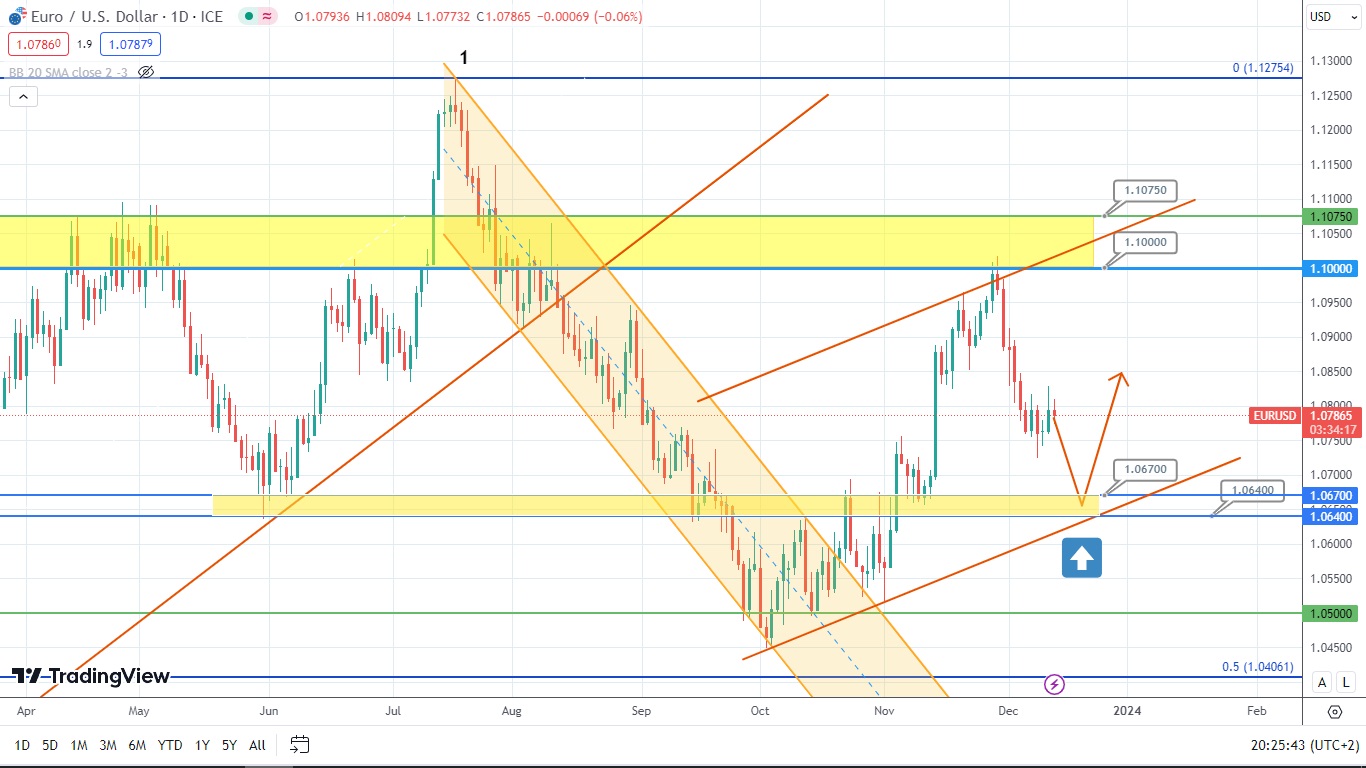
The price of the currency pair EUR/USD is heading down. It has been stuck in a very narrow range for some time now. Currently, the asset’s price is trying to form a flag, which usually signifies the continuation of a descending trend. The asset might potentially rebound from the supporting zone formed between levels 1.0640 and 1.0670. Only time will tell whether this scenario is going to work out.
Disclaimer: The material provided is for information purposes only and should not be considered as investment advice. The views, information, or opinions expressed in the text belong solely to the author, and not to the author’s employer, organization, committee or other group or individual or company.
Past performance is not indicative of future results.
High Risk Warning: CFDs are complex instruments and come with a high risk of losing money rapidly due to leverage. 69% and 73% of retail investor accounts lose money when trading CFDs with Tickmill UK Ltd and Tickmill Europe Ltd respectively. You should consider whether you understand how CFDs work and whether you can afford to take the high risk of losing your money.
Futures and Options: Trading futures and options on margin carries a high degree of risk and may result in losses exceeding your initial investment. These products are not suitable for all investors. Ensure you fully understand the risks and take appropriate care to manage your risk.