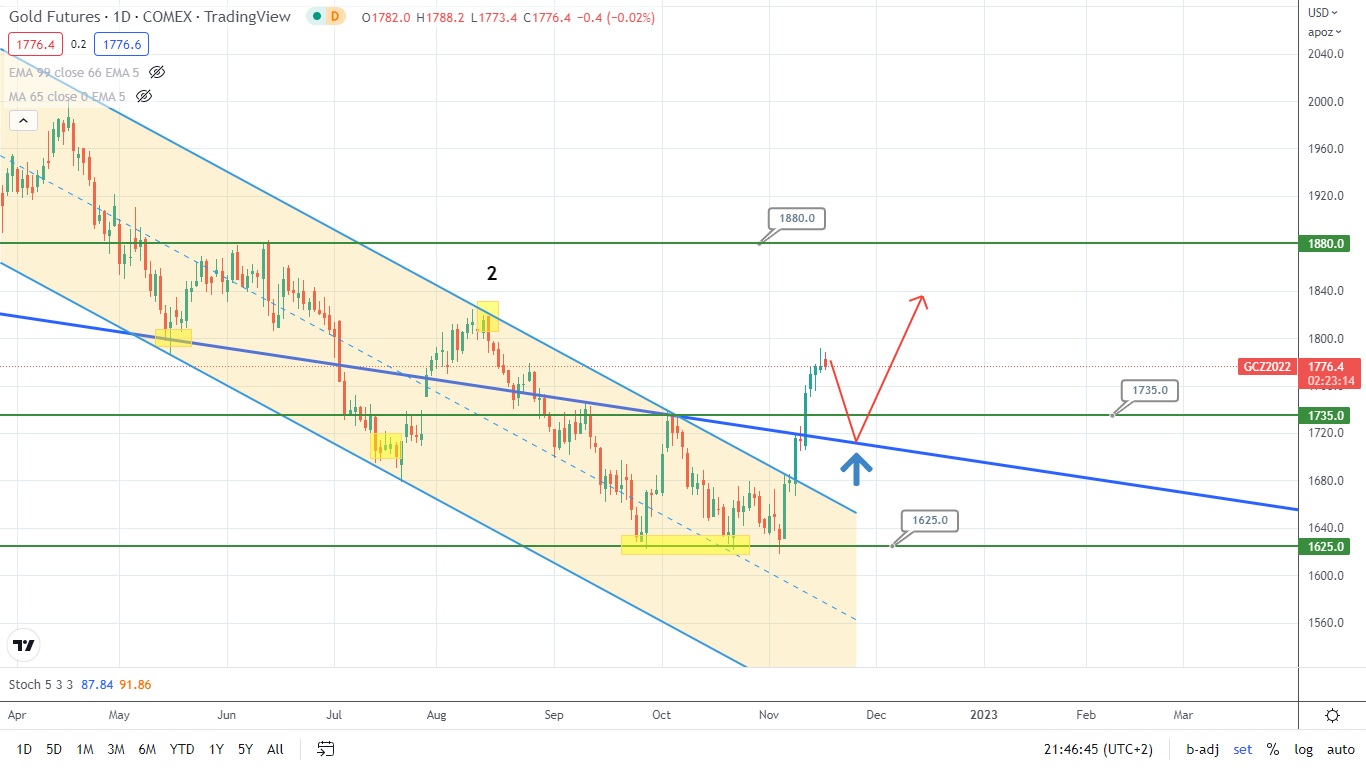
Gold Might Head North Soon
Gold broke the resistance at the level of 1735.00 and a very strong downtrend denoted by the blue line on the monthly timeframe. Currently, the asset’s price is trying to pull back to the broken trendlines. However, gold is likely to pull from the broken level and downtrend and jump. So, let’s observe what will happen next.
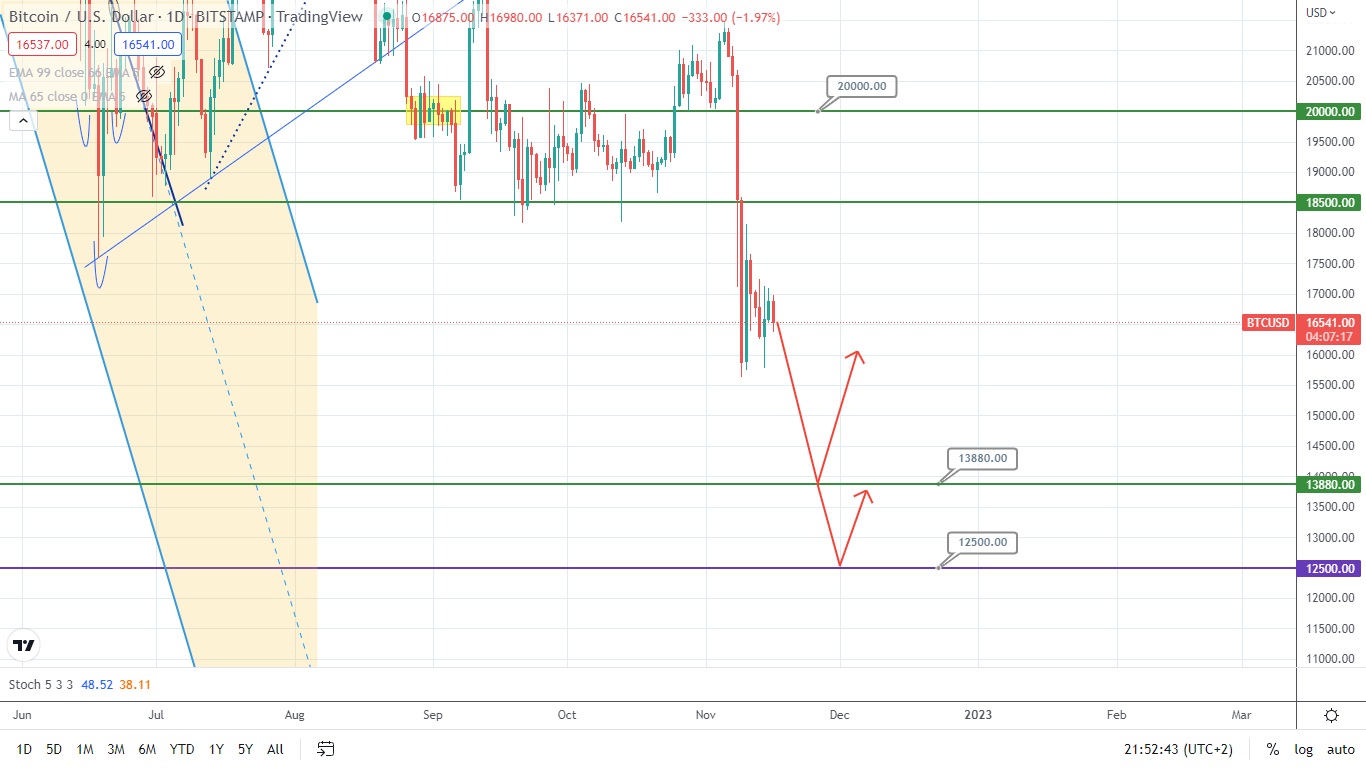
After the last deep dive, Bitcoin is moving around the level of 16500. The price of Bitcoin might drop to the supporting level of 13880 or even to the level of 12500. Bitcoin might potentially pull away from these levels and target the level of 20000 next.
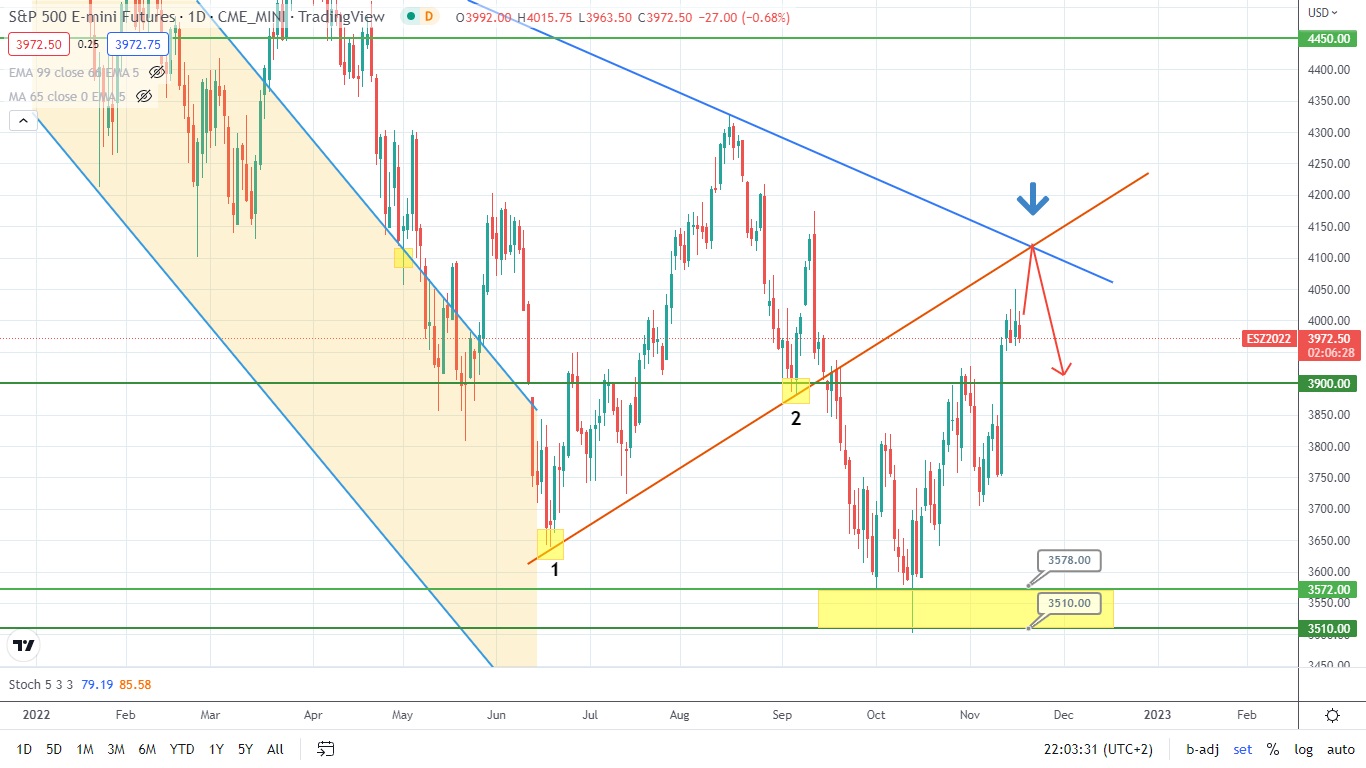
American stock index S&P 500 is heading up. The asset has closely approached the crossing point of the downtrend denoted by the blue line on the chart below and the broken uptrend formed between points 1 and 2. The index is likely to pull from the crossing point of these trendlines and drop to the level of 3900.00.
Disclaimer: The material provided is for information purposes only and should not be considered as investment advice. The views, information, or opinions expressed in the text belong solely to the author, and not to the author’s employer, organization, committee or other group or individual or company.
Past performance is not indicative of future results.
High Risk Warning: CFDs are complex instruments and come with a high risk of losing money rapidly due to leverage. 69% and 73% of retail investor accounts lose money when trading CFDs with Tickmill UK Ltd and Tickmill Europe Ltd respectively. You should consider whether you understand how CFDs work and whether you can afford to take the high risk of losing your money.
Futures and Options: Trading futures and options on margin carries a high degree of risk and may result in losses exceeding your initial investment. These products are not suitable for all investors. Ensure you fully understand the risks and take appropriate care to manage your risk.