EUR/USD Forecast: Potential Drop Ahead?
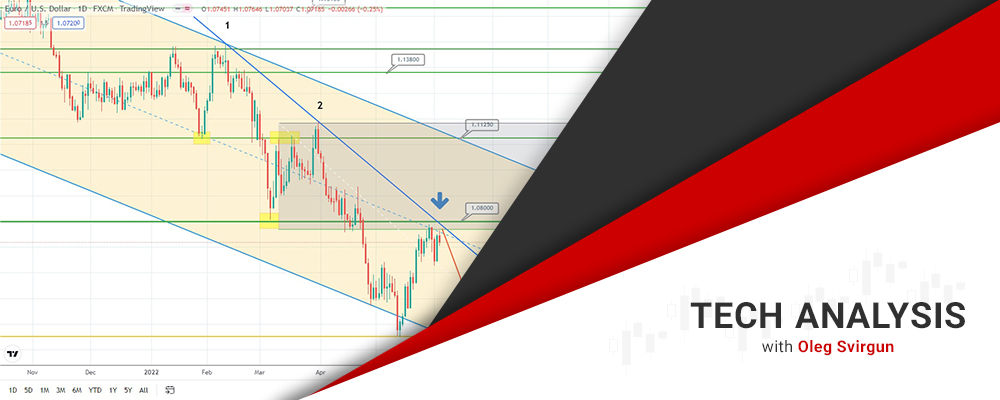
As it can be seen from the daily time frame, the price of the EUR/USD pair has approached the key levels such as a local downtrend (the points 1 and 2), horizontal resistance level of 1.0800, and 50% Fibonacci level expanded along the latest descending move (the level of 1.0770). Also, the asset’s price is located below the middle point of the weekly downtrend denoted on the chart by the dashed line. It seems that the currency pair might drop next week.

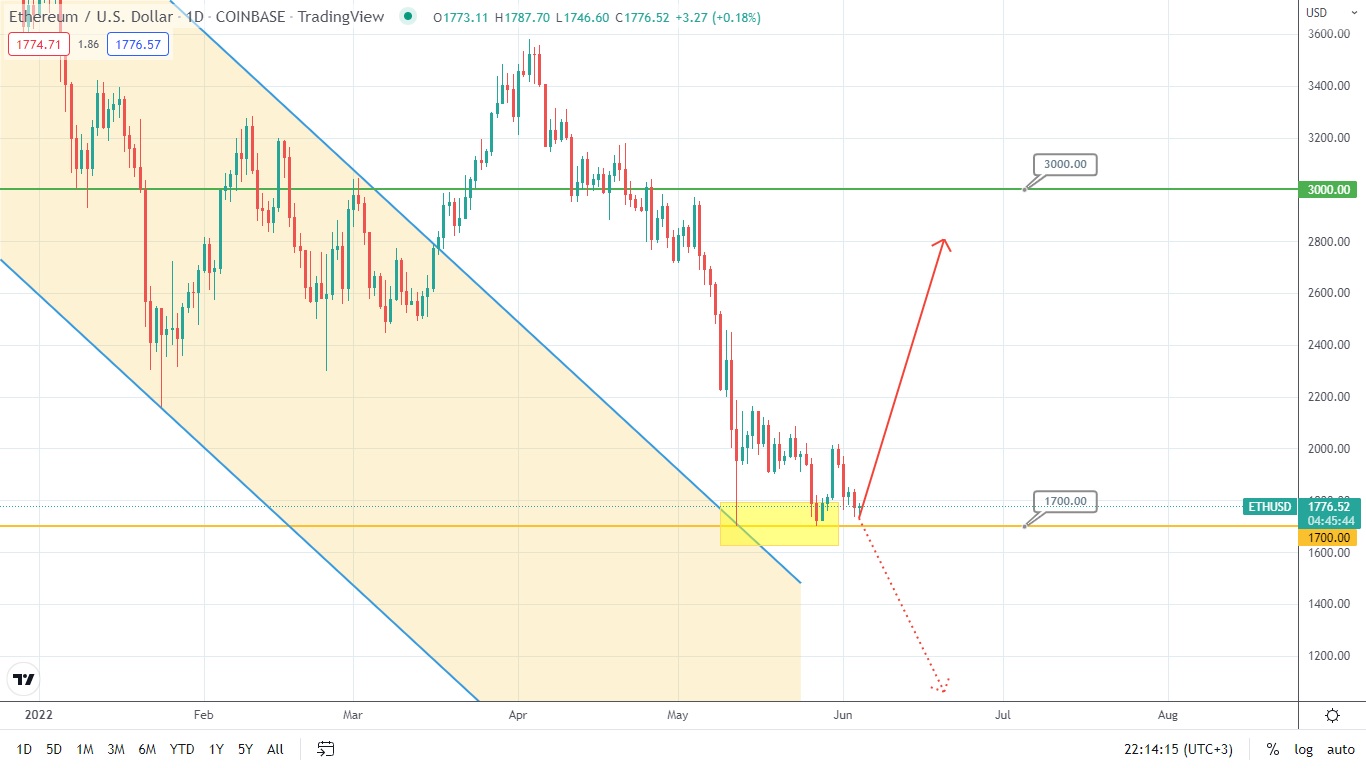
The price of Ethereum keeps testing a very strong psychological supporting level of 1700. Should Ethereum manage to break this level, it might drop. Currently, the asset is likely to jump, targeting the level of 3000.
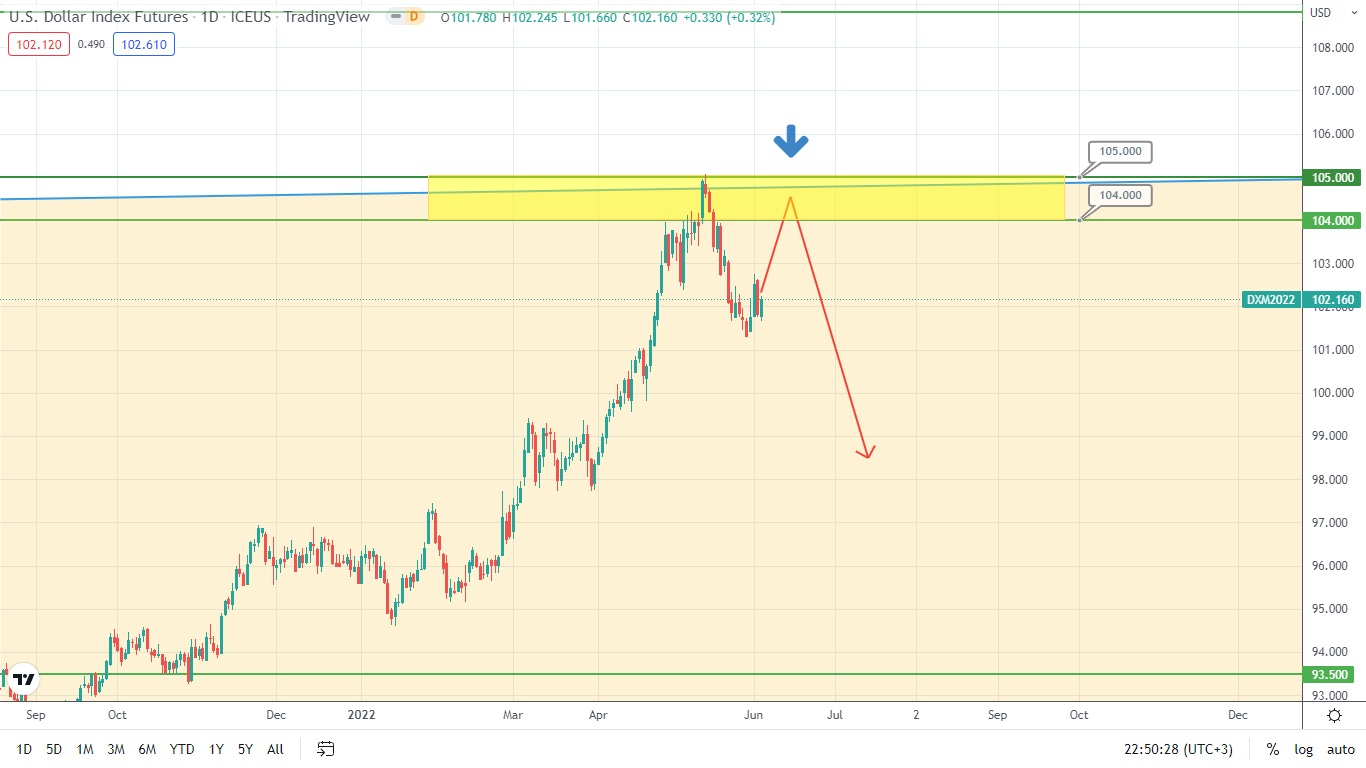
The U.S. Dollar Index is undergoing correction, but it is likely to retest the resistance area formed between the levels 104 and 105 and drop.
Disclaimer: The material provided is for information purposes only and should not be considered as investment advice. The views, information, or opinions expressed in the text belong solely to the author, and not to the author’s employer, organization, committee or other group or individual or company.
Past performance is not indicative of future results.
High Risk Warning: CFDs are complex instruments and come with a high risk of losing money rapidly due to leverage. 69% and 73% of retail investor accounts lose money when trading CFDs with Tickmill UK Ltd and Tickmill Europe Ltd respectively. You should consider whether you understand how CFDs work and whether you can afford to take the high risk of losing your money.
Futures and Options: Trading futures and options on margin carries a high degree of risk and may result in losses exceeding your initial investment. These products are not suitable for all investors. Ensure you fully understand the risks and take appropriate care to manage your risk.