Brent Oil And S&P500 Move Upwards
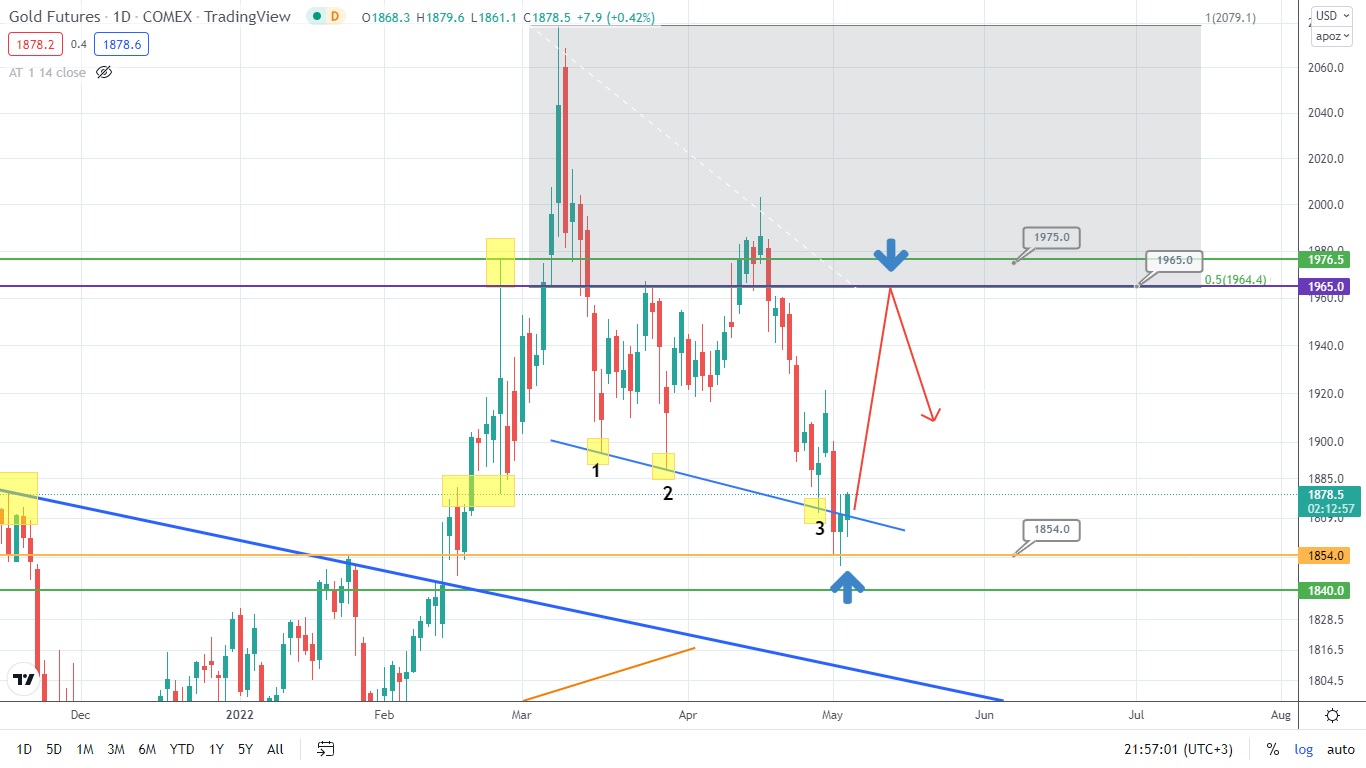
Gold has pulled back from the supporting level of 1854.00 and the median line denoted by the points 1, 2, and 3 on the chart below. Gold is likely to jump and face the resistance at the level of 1965.00 away from which it might pull back and drop.
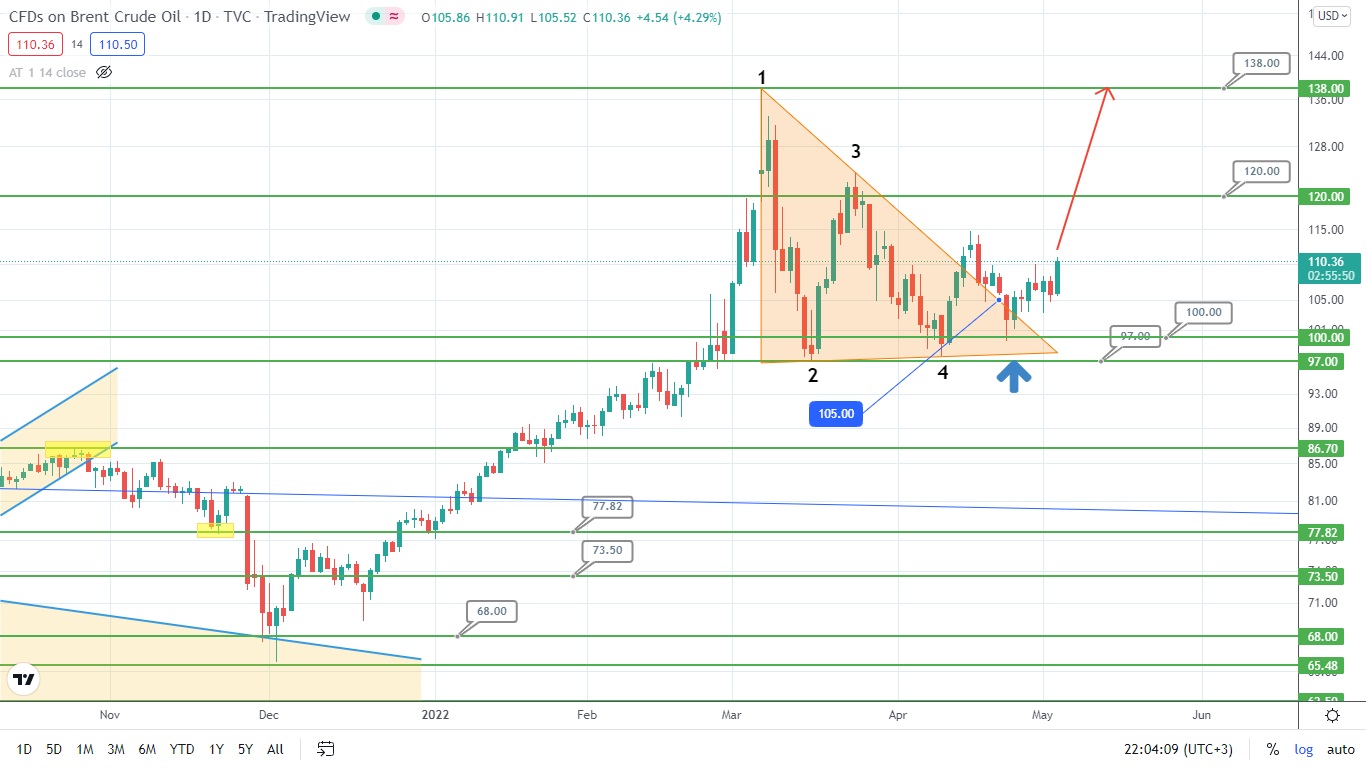
The price of Brent oil was moving along the broken side of the triangle. However, it has pulled back from this broken side and is currently gaining momentum. The oil should potentially target the height of the triangle or the level of 138.00. The price of 138 dollars per barrel might turn into a very interesting resistance quite soon.
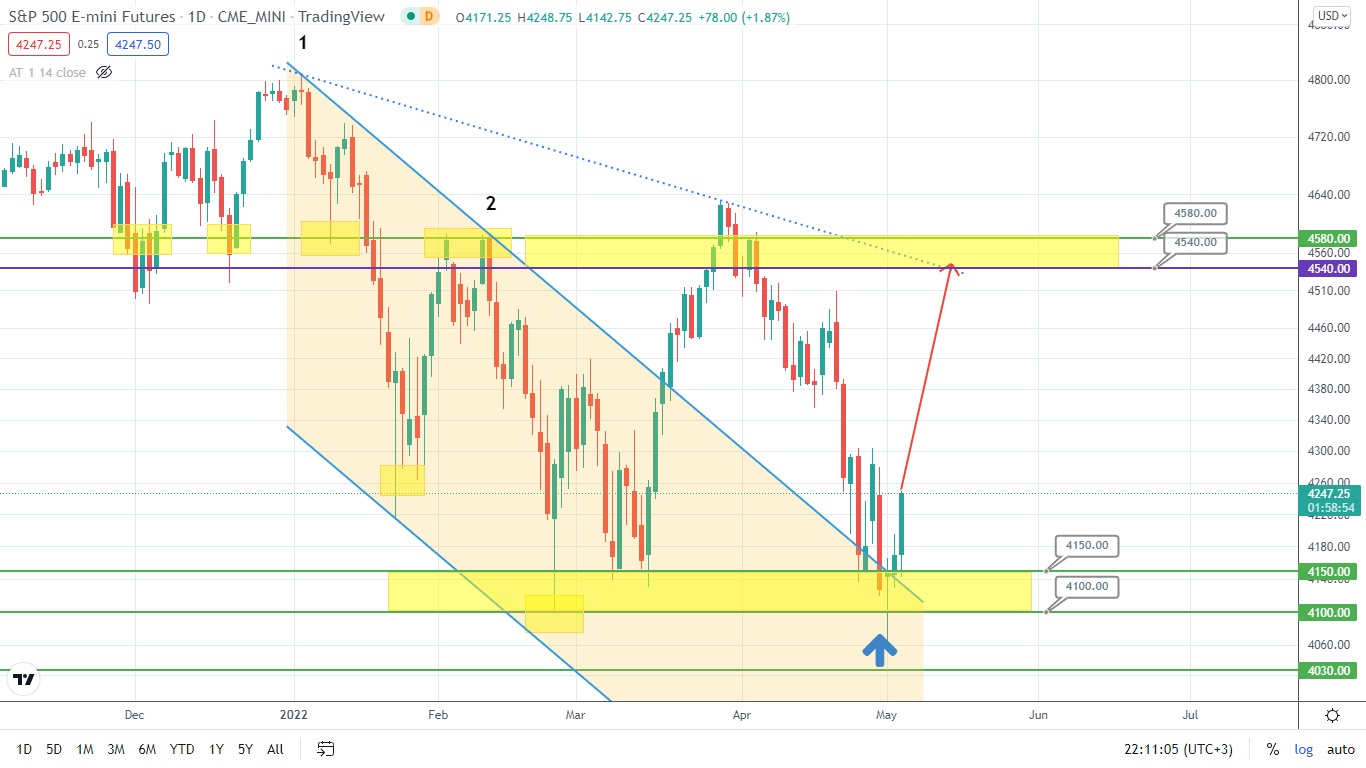
The US stock index S&P 500 has pulled from the supporting zone formed between the levels 4100 and 4150 as well as the broken downtrend. The index might potentially target the resistance area formed between the levels 4540 and 4580, which can reverse the asset’s price and send it down.
Disclaimer: The material provided is for information purposes only and should not be considered as investment advice. The views, information, or opinions expressed in the text belong solely to the author, and not to the author’s employer, organization, committee or other group or individual or company.
Past performance is not indicative of future results.
High Risk Warning: CFDs are complex instruments and come with a high risk of losing money rapidly due to leverage. 69% and 73% of retail investor accounts lose money when trading CFDs with Tickmill UK Ltd and Tickmill Europe Ltd respectively. You should consider whether you understand how CFDs work and whether you can afford to take the high risk of losing your money.
Futures and Options: Trading futures and options on margin carries a high degree of risk and may result in losses exceeding your initial investment. These products are not suitable for all investors. Ensure you fully understand the risks and take appropriate care to manage your risk.